29K iOS Apps Tracked Updated just now Revenue Forecasts
Add an app Create Account Sign In
Home

TradeMap: Acompanhe suas ações

68
Quality Score
Solid

TradeMap: Acompanhe suas ações

Medium confidence
4.7 ✍️ Editor
✍️ bumetric analysis

TradeMap: Acompanhe suas ações is an iOS app from Valemobi Consultoria Empresarial S/A in the Finance category, currently rated 4.7★ across 1,511 ratings. Initial signal reads as mostly critical sentiment so far: users flag rough edges and unmet expectations.

Quality Score is 68: Solid (established niche player). For a Finance app, that means established niche player. The full BU Investment Matrix below scores 8 dimensions including monetisation, growth, and operational risk.

Track changes month-over-month in the Performance section below: live snapshot history and revenue forecast included.

💰 Monthly revenue · now vs forecast
● Right now
$5.0K
per month
12-mo forecast
$5.2K – $10.8K
per month
24-mo forecast
$6.4K – $19.2K
per month
MID tier
💡 Grow this revenue
Free AI audit of this app’s store listing
  • Title & subtitle keyword fit
  • Description hook & conversion structure
  • Screenshots, ratings, reviews strategy
Run free AI audit →
Typical impact: +2-5× organic installs
🔔Notify me when this app's revenue changes by

📊 Performance Tracking LIVE

Loading…
idle
0%
Rating
Reviews
Forecast Revenue / mo
Snapshots tracked
0
since first record
ONE-TIME · BUILD 💰 Estimated build cost
$135K
What it cost to build · not monthly revenue
Likely range $100K – $180K
$25K · MVP floor $100K · indie scale $500K+ · studio build
📈 Pays back in ~3.2y at current MRR

Synthetic estimate. Inputs: category complexity, file size, screen count, monetization layer, platform reach, age × team-size proxy. Calibrated against 2024-2026 indie-agency rate surveys. Full math + source list on /methodology.

Where the money goes
🧱 MVP baseline (design + 1-store ship) +$28K
📱 5 unique screens × $4.5K +$22K
📦 Asset bundle (131 MB) +$32K
Finance complexity ×1.60 +$49K
Total estimate $135K
ONE-TIME · EXIT VALUE 💵 Estimated acquisition value
$75K
What it would sell for · not monthly revenue
Marketplace range $50K – $100K · 20× MRR multiple
💸 ~0.6× build cost (under-water)

Synthetic estimate. Multiple band derived from ad-supported + age, rating quality, category demand, and user-base maturity. Calibrated against 2024-2026 indie-app-marketplace closed-deal medians. Full math + comparable deal list on /methodology.

How the multiple was built
📺 Ad-supported base 15× MRR
★ rating ≥ 4.7 (premium) +15%
🏷 Finance category multiple +15%
Final multiple 20× MRR
👥 Estimated audience size
90K
Lifetime downloads (US-equivalent)
Monthly active
25K
Daily active
10K

Synthetic estimate from ratings × category benchmarks. Calibrated against 2024-2026 mobile-attribution retention + DAU/MAU reports. Numbers are US-storefront-equivalent — true global audience can be 5-10× larger for international apps. Full math + source list on /methodology.

How we sized it
📲 Finance engagement ~60 installs / rating
🔁 Finance D30 retention 28%
📍 DAU / MAU stickiness 0.40
DAU / MAU 40% sticky
🔬

How we forecast this revenue

MEDIUM CONFIDENCE
Baseline
$5.0K/mo · ML-estimated from 234 triggers
Growth rate
+4.0% MoM · MID tier baseline (compound monthly)
6 months
$4.7K – $7.9K
12 months
$5.2K – $10.8K
24 months
$6.4K – $19.2K
Compound growth at +4.0% MoM (tier baseline for MID). Range widens with horizon — typical noise band ±25% at 6mo.. Ranges widen with horizon — distant futures carry more uncertainty.
📊

BU Investment Matrix

Below median · 47/100MID TIERunderperforming peers
GrowthFounderQualityRevenueMonetiz.MoatMarketSafety
Growth Velocity
5.0
Founder Strength
3.0
Product Quality
8.5
Revenue Strength
3.7
Monetization Maturity
1.0
Defensibility
4.0
Market Position
2.0
Operational Safety
10.0
  • 💰 Revenue: Modest — $3K - $7K/mo · MID tier · medium confidence, trajectory unclear.
  • ⭐ Quality: 4.73★ across 1,511 reviews — strong (top 10%).
  • 📍 Market: Not yet charting in any of the 9 monitored markets.
  • 📈 Growth: Insufficient signal to assess trajectory.
  • ⚠️ Risk: Low — no material risk signals detected.
🎯 For competitors: Mixed picture. Worth competing if you have a clear UX or pricing edge — otherwise crowded segment.
💵 For acquirers: Estimated asking range 18-32× monthly = $90K-$160K.
Composite of 8 dimensions computed deterministically from public signals — no LLM, every score traces back to a measurable input. Default weights shown; "compete" / "acquire" / "invest" lenses re-weight without re-fetching.
Range:

💰 Forecast Revenue / mo

MODEL
Revenue forecast computed from BU's 234 trigger model on each snapshot. Calibrated against ground-truth from 58 verified-revenue apps.
🔬Forecast Breakdown — Why This Estimate?Top 6 of 6 triggers
Our ML model uses 200+ signals from public data. These are the most influential for this app:
Paid app ($0.00)METRIC
+$2,800
Excellent rating (4.7★)METRIC
+$2,200
bugsREVIEW
−$1,800
Low install base (1,511 ratings)METRIC
+$1,500
Mature app (8y old)METRIC
+$1,500
Single-language (English only)METRIC
−$400
METRIC = structural app data · REVIEW = mined from user reviews · ✓ VERIFIED = Stripe-verified anchor (TrustMRR)

📈 Reviews Growth

LIVE
Cumulative review count from first BU snapshot. Each point = a tracked update.

⭐ Rating Trend

LIVE
Average rating evolution. Updates with each new review batch.

🆕 What's New · v7.2.8

Fala, investidor! Confira as novidades dessa nova versão:


- Ajustes e Correções de bugs

Atualize o app e aproveite!

Profile & Insights

Everything we know — and don't — about this app and its company.

Identification

App name
TradeMap: Acompanhe suas ações
Developer
Valemobi Consultoria Empresarial S/A
Bundle ID
com.valemobi.newvalebroker
App Store URL
Open in App Store
Category
Finance
Content rating
17+
Languages
EN

Company

Website
Not found
Tagline
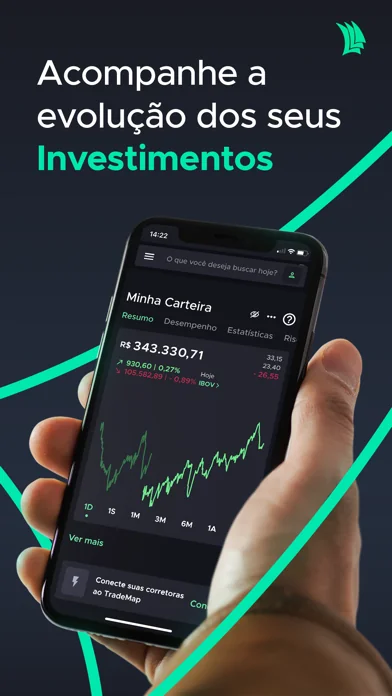
Seus investimentos na melhor direção.​
Description
Torne-se um investidor completo com o TradeMap! Acompanhe sua carteira e ativos do Brasil e dos EUA em tempo real, notícias, compare fundos e mais!
Founded
Not found
HQ / Address
Not found
Employees
Not found
Logo
Available

Revenue

Verified revenue / mo
Not found
AI revenue estimate / mo
Not found
AI annual estimate
Not found
ML model estimate / mo
$3.6K/mo
Top-grossing rank
🇧🇷#14 /100
All-time revenue
Not found
Pricing
Not found

Founder

Name
Not found
X / Twitter
twitter.com/trademapapp
LinkedIn
linkedin.com/company/11712449/admin
GitHub
Not found
X followers
Not found
Public statements
Not found

Funding

Funding data not yet collected for this app.

Press & Links

Press & Links data not yet collected for this app.

Contacts & Socials

Contacts & Socials data not yet collected for this app.
📈Ratings growth1,511 ratings+37675% lifetimeShow 3-year history estimate ▾Dec 2018May 2023Jun 2026
Tracked (54 weeks) Pre-tracking estimate (37 weeks) · model-based, ±5% noise · anchored to release date and current value
🗺️Geographic Distribution1 of 9 markets
🇧🇷
BR
Top-grossing rank: #14 / 100
Other markets
Outside top 100
in US, GB, DE, FR, JP, CA, AU, BR, IN
This app currently ranks in only one of the 9 markets we monitor. Niche or regional apps often launch this way before global rollout. Rankings update daily.
📊Category Rank Trajectory#14 now · best #12 · worst #40
Lower line = better rank · Estimate from ratings growth model · Lower position on chart = worse rank · Higher = top of chart
Profile is built from iTunes Lookup + developer site scrape + ML revenue model. Empty fields show "Not found" — additional sources (Crunchbase, X, IndieHackers, Acquire.com) coming.

📝 About this app

Conheça a nova experiência do TradeMap: um app que traduz o mundo dos investimentos em algo intuitivo e acessível :)

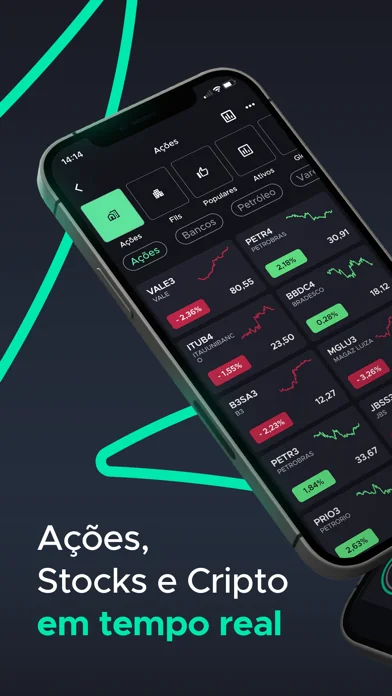
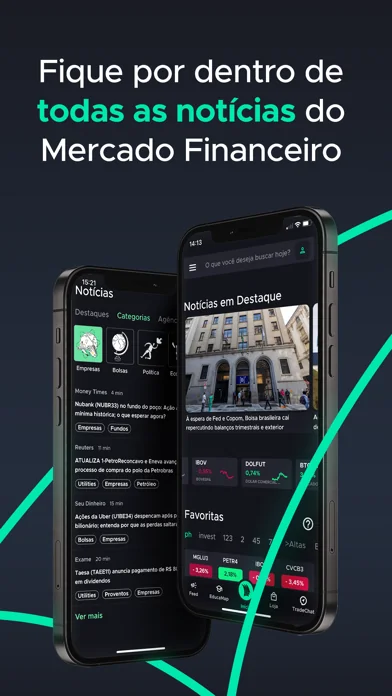
É o TradeMap que você já conhece, mas agora com uma proposta visual mais moderna, navegação fluida, nova usabilidade e ainda mais recursos para você poder explorar o mercado financeiro.
Uma plataforma feita para todos! E que veio para facilitar o acesso e entendimento de funções do mercado, estimular a troca de conhecimentos e, principalmente, inovar na sua experiência com ferramentas para você tomar as melhores decisões de investimentos.
Baixe agora! E conte com:… View full description on the official store →
App Specs
🔐 Own this app? Claim & verify MRR →
💾 131 MB🔞 17+📱 iOS 13.0+🔖 v7.2.8🔄 updated 0d ago🌐 EN📂 Finance💰 Free
📅

What Worked™ · Development Pipeline

9 EVENTS TRACKED
Detected changes in this app over its tracked lifetime — each event links cause (what changed) to effect (what moved). Sorted newest first.See full history →Version history →
2026-05
📈
Crossed 500 ratings — social-proof flywheel kicking in
2026-05
🔄
Monetization changed: paid → free
2026-03
Rating ↑ 2.79 → 4.75 (improved 1.96★)
2026-03
📈
Crossed 100 ratings — social-proof flywheel kicking in
2021-10
📈
Crossed 50 ratings — social-proof flywheel kicking in
2019-06
📈
Crossed 10 ratings — social-proof flywheel kicking in
2019-04
Rating ↓ 3.71 → 3.38 (dropped 0.33★)
2018-11
Rating ↓ 5.00 → 3.67 (dropped 1.33★)
2018-08
🚀
First tracked snapshot — initial data captured
🌍

Multi-Country Performance

Available in 9 of 9 monitored markets
MarketRatingReviewsCurrent version
🇦🇺 AU4.68531★1434.68531★ this version
🇧🇷 BR4.7194★66,5654.7194★ this version
🇨🇦 CA4.68462★1304.68462★ this version
🇩🇪 DE4.82222★454.82222★ this version
🇫🇷 FR4.77273★444.77273★ this version
🇬🇧 GB4.7541★1834.7541★ this version
🇮🇳 IN0★0
🇯🇵 JP4.70652★2764.70652★ this version
🇺🇸 US4.72733★1,5114.72733★ this version
🔔

Track this app’s revenue

FREE
Get an email when revenue moves by your threshold. No spam, unsubscribe in one click.

📝 Description

95
BU Score · Transcendent
Full revenue analysis
Read the article-style breakdown for TradeMap: Acompanhe suas ações: category rank, percentile, growth signal, comparable apps, and how the forecast is calibrated against verified-MRR anchors in this niche.
Read deep-dive →

Similar apps in Finance

About this analysis
ZCAnalyzed by Zakhar Chumak · founder, bumetric·Full methodology·Medium confidence

Why medium confidence: 1,511 ratings · no founder-verified revenue (model estimate only).

Frequently Asked Questions

4 answers · auto-generated from this app's public data
How much does TradeMap make per month?
Based on our ML-calibrated revenue forecast, TradeMap earns approximately $3.6K/mo. This is a US-storefront-equivalent estimate; global revenue can be several times larger for internationally-distributed apps. See the methodology page for the full formula and confidence bands.
What apps are like TradeMap?
Browse the full Finance category catalog to find similar apps with revenue, build cost, audience and tech stack data. Each /p/{slug} page also shows a Compare side-by-side widget with three peer apps from the same niche.
Who makes TradeMap?
TradeMap is published by Valemobi Consultoria Empresarial S/A on the Apple App Store. See the full publisher portfolio (other apps by the same developer) via the More by developer block on the product page above.
What is TradeMap's BU Score?
TradeMap has a BU Score of 68/100 (Solid). The score combines App Store rating, ratings count, monetization model and revenue signals calibrated against founder-verified MRR anchors. See the BU Score formula.