29K iOS Apps Tracked Updated just now Revenue Forecasts
Add an app Create Account Sign In
Home

AXS Tickets

75
Quality Score
Strong

AXS Tickets

High confidence
4.7 ✍️ Editor
✍️ bumetric analysis

AXS Tickets is an iOS app from AXS in the Entertainment category, currently rated 4.7★ across 491,449 ratings. Initial signal reads as mostly critical sentiment so far: users flag rough edges and unmet expectations.

Quality Score is 75: Strong (healthy traction). For a Entertainment app, that means healthy traction. The full BU Investment Matrix below scores 8 dimensions including monetisation, growth, and operational risk.

Track changes month-over-month in the Performance section below: live snapshot history and revenue forecast included.

💰 Monthly revenue · now vs forecast
● Right now
$3.0M
per month
12-mo forecast
$3.2M – $4.9M
per month
24-mo forecast
$3.8M – $7.1M
per month
BIG tier
💡 Grow this revenue
Free AI audit of this app’s store listing
  • Title & subtitle keyword fit
  • Description hook & conversion structure
  • Screenshots, ratings, reviews strategy
Run free AI audit →
Typical impact: +2-5× organic installs
🔔Notify me when this app's revenue changes by

📊 Performance Tracking LIVE

Loading…
idle
0%
Rating
Reviews
Forecast Revenue / mo
Snapshots tracked
0
since first record
ONE-TIME · BUILD 💰 Estimated build cost
$80K
What it cost to build · not monthly revenue
Likely range $60K – $110K
$25K · MVP floor $100K · indie scale $500K+ · studio build
📈 Slow ROI — current MRR is well below build cost

Synthetic estimate. Inputs: category complexity, file size, screen count, monetization layer, platform reach, age × team-size proxy. Calibrated against 2024-2026 indie-agency rate surveys. Full math + source list on /methodology.

Where the money goes
🧱 MVP baseline (design + 1-store ship) +$28K
📱 5 unique screens × $4.5K +$22K
📦 Asset bundle (74 MB) +$9K
Entertainment complexity ×1.30 +$17K
Total estimate $80K
👥 Estimated audience size
73.5M
Lifetime downloads (US-equivalent)
Monthly active
8.8M
Daily active
3.5M

Synthetic estimate from ratings × category benchmarks. Calibrated against 2024-2026 mobile-attribution retention + DAU/MAU reports. Numbers are US-storefront-equivalent — true global audience can be 5-10× larger for international apps. Full math + source list on /methodology.

How we sized it
📲 Entertainment engagement ~150 installs / rating
🔁 Entertainment D30 retention 12%
📍 DAU / MAU stickiness 0.40
DAU / MAU 40% sticky
🔬

How we forecast this revenue

MEDIUM CONFIDENCE
Baseline
$3.0M/mo · ML-estimated from 234 triggers
Growth rate
+2.5% MoM · BIG tier baseline (compound monthly)
6 months
$3.0M – $4.0M
12 months
$3.2M – $4.9M
24 months
$3.8M – $7.1M
Compound growth at +2.5% MoM (tier baseline for BIG). Range widens with horizon — typical noise band ±15% at 6mo.. Ranges widen with horizon — distant futures carry more uncertainty.
📊

BU Investment Matrix

Concerning · 52/100BIG TIERbelow benchmarks
GrowthFounderQualityRevenueMonetiz.MoatMarketSafety
Growth Velocity
5.0
Founder Strength
3.5
Product Quality
9.3
Revenue Strength
6.5
Monetization Maturity
1.0
Defensibility
4.5
Market Position
2.0
Operational Safety
10.0
  • 💰 Revenue: Healthy — $1.2M - $6.6M/mo · BIG tier · medium-low confidence, trajectory unclear.
  • ⭐ Quality: 4.65★ across 486,867 reviews — exceptional (top 1% in category).
  • 📍 Market: Not yet charting in any of the 9 monitored markets.
  • 📈 Growth: Insufficient signal to assess trajectory.
  • ⚠️ Risk: Low — no material risk signals detected.
🎯 For competitors: Mixed picture. Worth competing if you have a clear UX or pricing edge — otherwise crowded segment.
💵 For acquirers: Estimated asking range 18-32× monthly = $54.0M-$96.0M.
Composite of 8 dimensions computed deterministically from public signals — no LLM, every score traces back to a measurable input. Default weights shown; "compete" / "acquire" / "invest" lenses re-weight without re-fetching.
Range:

💰 Forecast Revenue / mo

MODEL
Revenue forecast computed from BU's 234 trigger model on each snapshot. Calibrated against ground-truth from 58 verified-revenue apps.
🔬Forecast Breakdown — Why This Estimate?Top 6 of 6 triggers
Our ML model uses 200+ signals from public data. These are the most influential for this app:
High install base (491,449 ratings)METRIC
+$12,000
premiumREVIEW
+$2,200
Excellent rating (4.7★)METRIC
+$2,200
Mature app (12y old)METRIC
+$1,500
Ad-supported / freemiumMETRIC
+$600
Localized (5 languages)METRIC
+$600
METRIC = structural app data · REVIEW = mined from user reviews · ✓ VERIFIED = Stripe-verified anchor (TrustMRR)

📈 Reviews Growth

LIVE
Cumulative review count from first BU snapshot. Each point = a tracked update.

⭐ Rating Trend

LIVE
Average rating evolution. Updates with each new review batch.

🆕 What's New · v6.28

This update includes performance improvements and bug fixes.

Profile & Insights

Everything we know — and don't — about this app and its company.

Identification

App name
AXS Tickets
Developer
AXS
Bundle ID
com.axs.AXSMobile
App Store URL
Open in App Store
Category
Entertainment
Content rating
4+
Languages
EN, FR, DE, JA, SV

Company

Website
www.axs.com
Tagline
Not found
Description
Not found
Founded
Not found
HQ / Address
Not found
Employees
Not found
Logo
Not found

Revenue

Verified revenue / mo
Not found
AI revenue estimate / mo
Not found
AI annual estimate
Not found
ML model estimate / mo
$298/mo
Top-grossing rank
Outside top 100 in US Entertainment
All-time revenue
Not found
Pricing
Not found

Founder

Founder data not yet collected for this app.

Funding

Funding data not yet collected for this app.

Press & Links

Press & Links data not yet collected for this app.

Contacts & Socials

Contacts & Socials data not yet collected for this app.
AI Revenue EstimateCONFIDENCE: LOW
Direct revenue for the iOS app "AXS Tickets" cannot be estimated from public sources. The app is listed as free with no in-app purchases, indicating it serves as a transactional platform for the broader AXS ticketing business rather than generating direct revenue through app store mechanisms. AXS, the parent company, generates revenue from ticket sales and associated fees, with estimated annual revenue for AXS.com being $246.8 million. In 2015, the combined entity of AXS and Veritix generated over $2 billion in annual transactions.
Sources mentioned: Sensor Tower, Growjo, Wikipedia, Reddit
📈Ratings growth491,449 ratings+17% lifetimeShow 3-year history estimate ▾Jun 2023Jan 2025Jun 2026
Tracked (2 weeks) Pre-tracking estimate (37 weeks) · model-based, ±5% noise · anchored to release date and current value
🌍Geographic ReachNot ranked
This app is currently outside the top 100 grossing in all 9 countries we monitor (US, UK, DE, FR, JP, CA, AU, BR, IN). Niche or new apps often launch this way — popularity rankings appear once daily revenue clears the regional threshold.
Profile is built from iTunes Lookup + developer site scrape + ML revenue model. Empty fields show "Not found" — additional sources (Crunchbase, X, IndieHackers, Acquire.com) coming.

📝 About this app

Tap for tickets to see the artists and teams you love. With the AXS app, you can find great events near you, buy 100% official tickets, sell your seats if you can’t go, and more. It’s all a fan needs, all in one app.

BUY THE PERFECT TICKETS
Front row or on the aisle? Pick your exact seats on interactive maps, get more ticket options with AXS Official Resale, and go in style with AXS Premium or VIP offers.

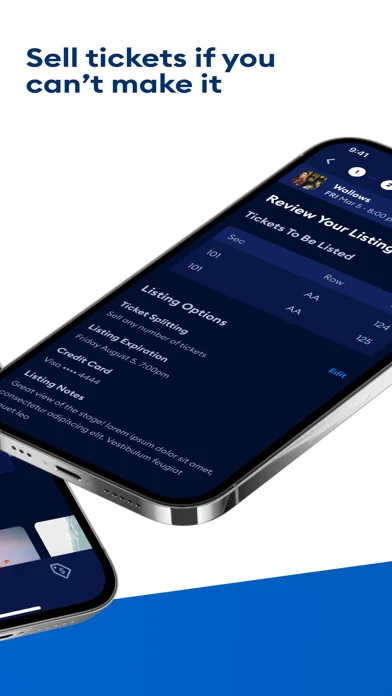
EASILY SELL YOUR TICKETS
Plans can change. If you have seats from AXS but can’t make it, quickly list the tickets for sale from your account and reach tons of potential buyers.… View full description on the official store →
App Specs
🔐 Own this app? Claim & verify MRR →
💾 74 MB🔞 4+📱 iOS 15.0+🔖 v6.28🔄 updated 0d ago🌐 EN, FR, DE, JA, SV📂 Entertainment💰 Paid
📅

What Worked™ · Development Pipeline

2 EVENTS TRACKED
Detected changes in this app over its tracked lifetime — each event links cause (what changed) to effect (what moved). Sorted newest first.See full history →Version history →
2026-04
🔧
Shipped update — v? → v6.27.2
2026-04
🚀
First tracked snapshot — initial data captured
🌍

Multi-Country Performance

Available in 9 of 9 monitored markets
MarketRatingReviewsCurrent version
🇦🇺 AU4.38363★1,5644.38363★ this version
🇧🇷 BR4.25305★5734.25305★ this version
🇨🇦 CA4.46613★8,8864.46613★ this version
🇩🇪 DE4.35738★1,1364.35738★ this version
🇫🇷 FR4.44798★9424.44798★ this version
🇬🇧 GB4.59096★54,9654.59096★ this version
🇮🇳 IN4.48★1254.48★ this version
🇯🇵 JP4.20763★1,3874.20763★ this version
🇺🇸 US4.64566★490,4804.64566★ this version
🔔

Track this app’s revenue

FREE
Get an email when revenue moves by your threshold. No spam, unsubscribe in one click.

📝 Description

95
BU Score · Transcendent
Full revenue analysis
Read the article-style breakdown for AXS Tickets: category rank, percentile, growth signal, comparable apps, and how the forecast is calibrated against verified-MRR anchors in this niche.
Read deep-dive →

Similar apps in Entertainment

About this analysis
ZCAnalyzed by Zakhar Chumak · founder, bumetric·Full methodology·High confidence

Why high confidence: 491,449 ratings · no founder-verified revenue (model estimate only).

Frequently Asked Questions

4 answers · auto-generated from this app's public data
How much does AXS Tickets make per month?
Based on our ML-calibrated revenue forecast, AXS Tickets earns approximately $298/mo. This is a US-storefront-equivalent estimate; global revenue can be several times larger for internationally-distributed apps. See the methodology page for the full formula and confidence bands.
What apps are like AXS Tickets?
Browse the full Entertainment category catalog to find similar apps with revenue, build cost, audience and tech stack data. Each /p/{slug} page also shows a Compare side-by-side widget with three peer apps from the same niche.
Who makes AXS Tickets?
AXS Tickets is published by AXS on the Apple App Store. See the full publisher portfolio (other apps by the same developer) via the More by developer block on the product page above.
What is AXS Tickets's BU Score?
AXS Tickets has a BU Score of 75/100 (Strong). The score combines App Store rating, ratings count, monetization model and revenue signals calibrated against founder-verified MRR anchors. See the BU Score formula.