What Cincy EZPark actually does (from store listing)
No more digging for coins. This is how parking should be. Pay, extend, and manage your parking session with Cincinnati's official parking app. It’s easy!
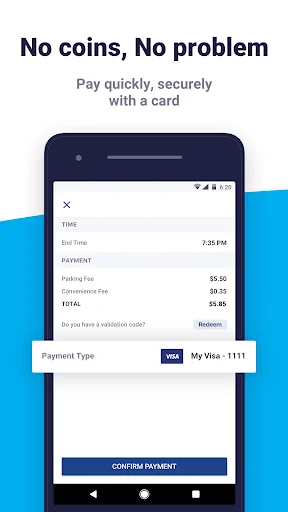
PAY ON THE GO
Pay quickly and securely with your smartphone.
- Time's precious, stop wasting it feeding a meter.
- Forget refilling the meter in the rain or braving the cold.
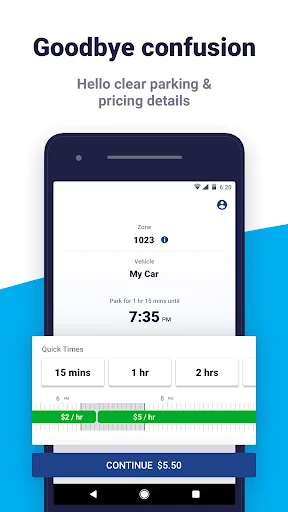
NO PRICE SURPRISES
See when parking rates will change in the future – even when there’s free parking!
- Receive email receipts at the end of your parking sessi…
No more digging for coins. This is how parking should be. Pay, extend, and manage your parking session with Cincinnati's official parking app. It’s easy!
PAY ON THE GO
Pay quickly and securely with your smartphone.
- Time's precious, stop wasting it feeding a meter.
- Forget refilling the meter in the rain or braving the cold.
NO PRICE SURPRISES
See when parking rates will change in the future – even when there’s free parking!
- Receive email receipts at the end of your parking session.
- Expenses made easy, manage your parking history through the mobile app.
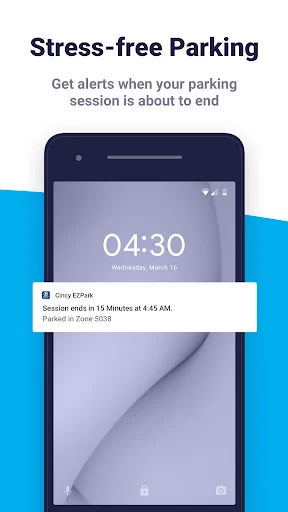
STRESS-FREE PARKING
Get alerts when your parking session is about to end.
- Stop worrying about how much time is left on the meter, we have you covered.
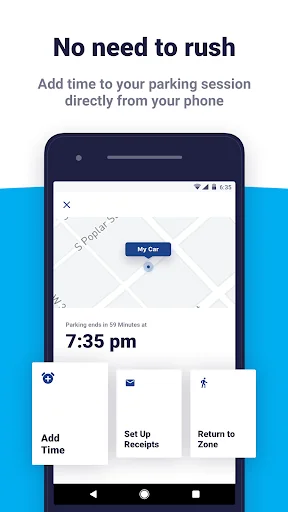
NO NEED TO RUSH
Add time to your parking session directly from your phone.*
- Your plans change, your parking spot shouldn't. Simply extend your parking session via our app.
--------
GET STARTED TODAY
1. Download the Cincy EZPark app.
2. Park where you see Cincy EZPark app signs.
3. Pay for your parking session from your phone.
4. Relax, welcome to parking as it should be.
--------
COMING SOON
The Cincy EZPark app is not done yet! We're constantly updating the app based on your feedback.
--------
APP PERMISSIONS
- Location Services (optional): Used to quickly provide nearby parking zones.
* where applicable
Comparable Android apps
The five apps in Travel & Local with the closest revenue to Cincy EZPark. Click any to see its detail page.
Each forecast combines App Store rating, ratings count, monetisation model, pricing tier, IAP signals and ad-supported flag.
The base estimate is then multiplied by a per-category scaling factor learned from apps with founder-verified MRR.
Every number on this page comes from public APIs and bumetric's own snapshot history.
Full methodology covers input variables, accuracy bands per category and how we treat apps without comparable anchors.
See also the live data on Cincy EZPark's tracker page for current rating, reviews and snapshot timeline.
Building something similar? Get a free AI audit with $-revenue forecasts for every recommendation.

 Solo Destination
 Žiogas
 Cheap Flights Tickets
 Chiltern Railways - Tickets
 Toyoko INN App