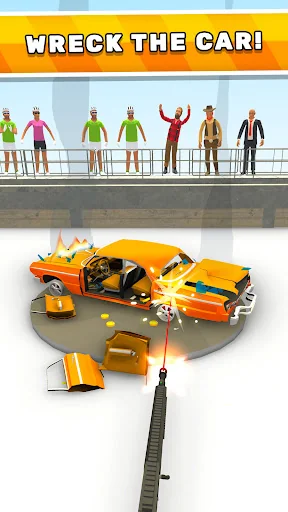
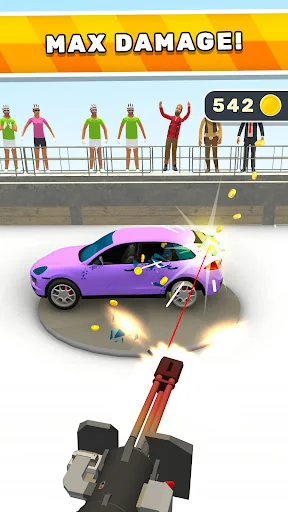
Experience the ultimate vehicular destruction in Fury Cars! Take control of powerful weapons and tools as you obliterate a variety of vehicles, from cars to buses to tanks, in the most satisfying ways imaginable.
Engage in adrenaline-pumping action as you unleash chaos upon the streets, using an arsenal of weapons and tools to wreak havoc on your unsuspecting targets. From explosive rockets to devastating machine guns, each weapon offers a unique and exhilarating way to decimate your foes.
…
Experience the ultimate vehicular destruction in Fury Cars! Take control of powerful weapons and tools as you obliterate a variety of vehicles, from cars to buses to tanks, in the most satisfying ways imaginable.
Engage in adrenaline-pumping action as you unleash chaos upon the streets, using an arsenal of weapons and tools to wreak havoc on your unsuspecting targets. From explosive rockets to devastating machine guns, each weapon offers a unique and exhilarating way to decimate your foes.
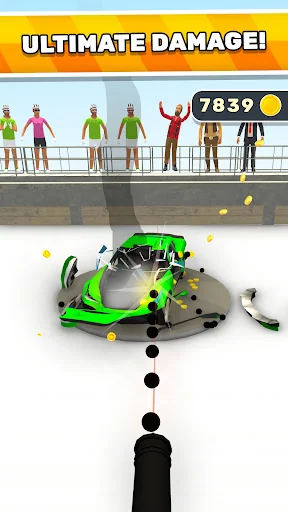
Upgrade your arsenal as you progress, unlocking new and more powerful weapons to unleash upon your enemies. With stunning graphics and immersive gameplay, Fury Cars delivers an action-packed experience that will leave you craving more destruction.
Are you ready to unleash mayhem and become the ultimate destroyer of vehicles? Download Fury Cars now and prepare for the most satisfying destruction spree of your life!
Comparable Android apps
The five apps in Arcade with the closest revenue to Fury Cars. Click any to see its detail page.
Each forecast combines App Store rating, ratings count, monetisation model, pricing tier, IAP signals and ad-supported flag.
The base estimate is then multiplied by a per-category scaling factor learned from apps with founder-verified MRR.
Every number on this page comes from public APIs and bumetric's own snapshot history.
Full methodology covers input variables, accuracy bands per category and how we treat apps without comparable anchors.
See also the live data on Fury Cars's tracker page for current rating, reviews and snapshot timeline.
Building something similar? Get a free AI audit with $-revenue forecasts for every recommendation.

 Attack the Block: Shoot'em Up
 Fishing Predator
 Cytus
Cytus
 Double Head Shark Attack PVP
 Mad Dentist