What Hawaii's Finest actually does (from store listing)
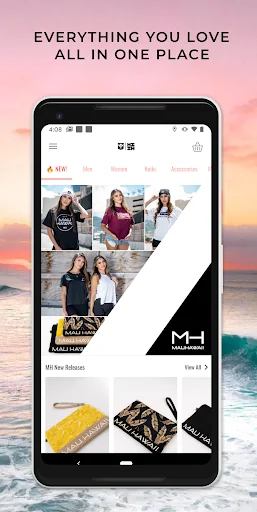
***We'll be offering App-EXCLUSIVE promotions and specials!***
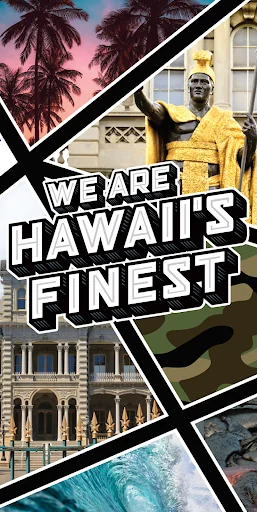
Since 2009, Hawaii’s Finest has been committed to bringing you the best and biggest in local apparel and music! We thrive on seeing our local ‘Ohana happy and satisfied! Through hard work, quality, and Aloha, Hawaii’s Finest has become one of Hawaii’s premier brands.
We promise to never give up or forget where we came from. We throw concerts that we love to attend and make shirts we love to wear.
WE ARE THE PEOPLE'S BRA…
***We'll be offering App-EXCLUSIVE promotions and specials!***
Since 2009, Hawaii’s Finest has been committed to bringing you the best and biggest in local apparel and music! We thrive on seeing our local ‘Ohana happy and satisfied! Through hard work, quality, and Aloha, Hawaii’s Finest has become one of Hawaii’s premier brands.
We promise to never give up or forget where we came from. We throw concerts that we love to attend and make shirts we love to wear.
WE ARE THE PEOPLE'S BRAND!
Comparable Android apps
The five apps in Shopping with the closest revenue to Hawaii's Finest. Click any to see its detail page.
Each forecast combines App Store rating, ratings count, monetisation model, pricing tier, IAP signals and ad-supported flag.
The base estimate is then multiplied by a per-category scaling factor learned from apps with founder-verified MRR.
Every number on this page comes from public APIs and bumetric's own snapshot history.
Full methodology covers input variables, accuracy bands per category and how we treat apps without comparable anchors.
See also the live data on Hawaii's Finest's tracker page for current rating, reviews and snapshot timeline.
Building something similar? Get a free AI audit with $-revenue forecasts for every recommendation.

 Seu Super
 리네아스토리아 LINEASTORIA
 위니비니 - WeenyBeeny
 Promple
 Shopping Help