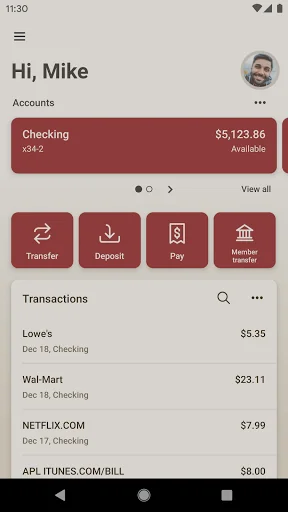
MyHSCU is your personal financial advocate that gives you the ability to aggregate all of your financial accounts, including accounts from other banks and credit unions, into a single view. It’s fast, secure and makes life easier by empowering you with the tools you need to manage your finances.
Here’s what else you can do with MyHSCU:
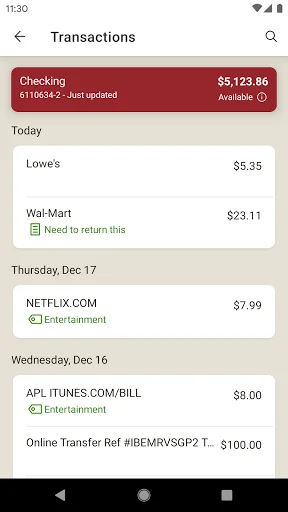
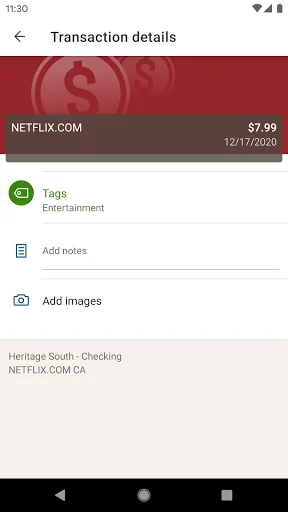
-Keep your transactions organized by allowing you to add tags, notes and photos of receipts and checks.
-Set up alerts so you know when your balance drops…
MyHSCU is your personal financial advocate that gives you the ability to aggregate all of your financial accounts, including accounts from other banks and credit unions, into a single view. It’s fast, secure and makes life easier by empowering you with the tools you need to manage your finances.
Here’s what else you can do with MyHSCU:
-Keep your transactions organized by allowing you to add tags, notes and photos of receipts and checks.
-Set up alerts so you know when your balance drops below a certain amount
-Make payments, whether you’re paying a company or a friend
-Transfer money between your accounts
-Deposit checks in a snap by taking a picture of the front and back
-Reorder your debit card or turn it off if you’ve misplaced it
-View and save your monthly statements
-Find branches and ATMs near you
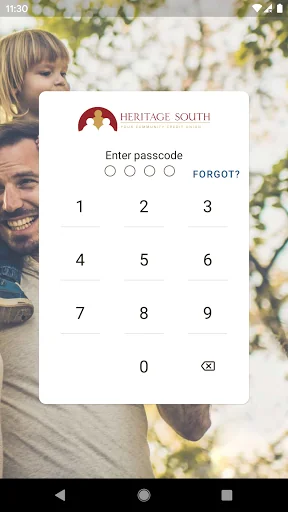
Secure your account with a 4-digit passcode and fingerprint or face reader on supported devices.
To use the MyHSCU Mobile app, one must be enrolled as a Heritage South CU Internet Banking user. If you currently use our Internet Banking, simply download the app, launch it, and login with the same Internet Banking credentials.
Comparable Android apps
The five apps in Finance with the closest revenue to MyHSCU. Click any to see its detail page.
Each forecast combines App Store rating, ratings count, monetisation model, pricing tier, IAP signals and ad-supported flag.
The base estimate is then multiplied by a per-category scaling factor learned from apps with founder-verified MRR.
Every number on this page comes from public APIs and bumetric's own snapshot history.
Full methodology covers input variables, accuracy bands per category and how we treat apps without comparable anchors.
See also the live data on MyHSCU's tracker page for current rating, reviews and snapshot timeline.
Building something similar? Get a free AI audit with $-revenue forecasts for every recommendation.

 iViKi
iViKi
 GoAuto Insurance
 TP1600
 SPARDAbanking
 LDB Trust