It has become clear that the current pharmacological nomenclature of psychotropic medications does not reflect our contemporary knowledge, nor does it inform properly the clinician of neuroscience-based prescriptions. Very often we prescribe “antidepressants” for “anxiety” disorders or “second-generation antipsychotics” to depressed patients.
This practice is confusing.
• Five international organizations ECNP, ACNP, AsCNP, CINP & IUPHAR decided five years ago to establish a taskforce and gave…
It has become clear that the current pharmacological nomenclature of psychotropic medications does not reflect our contemporary knowledge, nor does it inform properly the clinician of neuroscience-based prescriptions. Very often we prescribe “antidepressants” for “anxiety” disorders or “second-generation antipsychotics” to depressed patients.
This practice is confusing.
• Five international organizations ECNP, ACNP, AsCNP, CINP & IUPHAR decided five years ago to establish a taskforce and gave it the mission to embed our current neuroscience advances in the nomenclature.
• The scope is to include all the medications with CNS indications and to harness this new nomenclature to help clinicians when they are trying to figure out what would be the next rational “neuropsychopharmacological step”.
• In this second edition 22 new medications were added so NbN includes now 130 medications.
This proposed nomenclature aims to reflect the current pharmacological knowledge base and cannot necessarily represent the ultimate scientific truth.
The taskforce that assembled could have taken the stand that our current knowledge base is not enough to define the primary target or the correct mechanisms of action. But as a taskforce, we feel that it’s better to present a cutting-edge scientific interpretation than to wait for the definitive conclusion. We need to treat our patients now, and we cannot postpone treatment until all the facts are known.
Therefore this nomenclature is based on:
1. The need to treat now.
2. Updated neuroscience insights.
3. The judgment of the members of the taskforce.
Along these lines, we have come up with the following proposal:
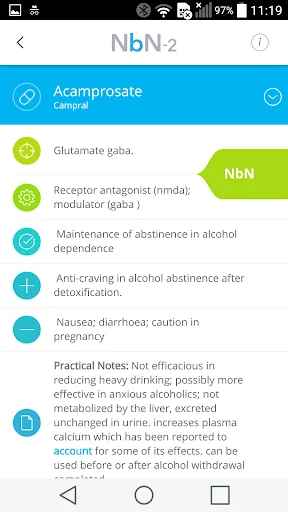
The Nomenclature:
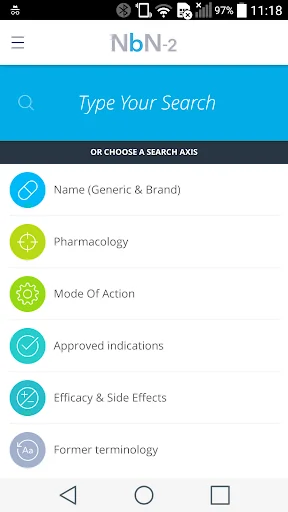
Pharmacology and Mode of Action – reflects the current knowledge and understanding about the targeted neurotransmitter/ molecule/system being modified and the mode/mechanism of action.
We also added 4 additional dimensions
4 Additional Dimensions:
Approved Indications – based on the recommendations of major regulatory bodies (e.g. FDA, EMA, etc.)
Efficacy and Side Effects – Driven from positive single, large, RCT and/or “heavy solid weight” clinical data. Only prevalent or life-threatening side effects were included
Practical Note – Summarizes the clinical knowledge that has been "filtered" through the taskforce's "sieve"
Neurobiology – This dimension is focused on the biology. It is divided into preclinical and clinical sections, with the emphasis on the latter
For those who would like to know more abo derived from empirical data.ut the pharmacology, there is a direct link to the relevant site of IUPHAR – our collaborator in this endeavour.
As this is on-going process, we recognize that the product is imperfect. Based on your feedback (and taking into account the feedback of other colleges) new reports and findings, appropriate updates (e.g. later editions) will be undertaken.
Comparable Android apps
The five apps in Medical with the closest revenue to NbN. Click any to see its detail page.
Each forecast combines App Store rating, ratings count, monetisation model, pricing tier, IAP signals and ad-supported flag.
The base estimate is then multiplied by a per-category scaling factor learned from apps with founder-verified MRR.
Every number on this page comes from public APIs and bumetric's own snapshot history.
Full methodology covers input variables, accuracy bands per category and how we treat apps without comparable anchors.
See also the live data on NbN's tracker page for current rating, reviews and snapshot timeline.
Building something similar? Get a free AI audit with $-revenue forecasts for every recommendation.
 Nursing Calculator
 FindAir – Asthma Diary
 Crack NCLEX - NCLEX Test Prep
 Medicina Consultiva
 Hellocare