Live screenshots from the Play Store, captured by our snapshot worker. Tap any image to enlarge.
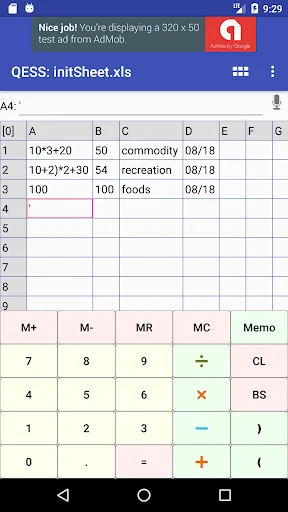
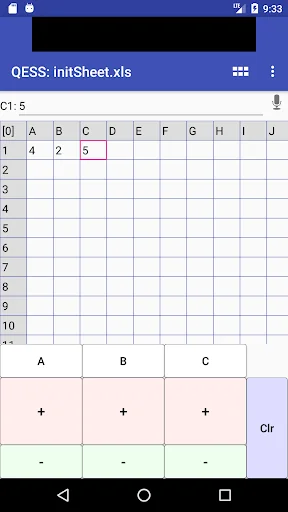
This is a spreadsheet focusing on effective and easy entry by using editable keypad (virtual keyboard).
This is the free version with ads. 'QESS pro' is the payed version without ads.
* Can assign cell movement and text entry to one key touch.
* Can edit the layout and action for the keypad.
*Can run without network.
* Can control the key action by using command sequence or JavaScript.
* Can read and write xls, xlsx, csv, tsv and txt.
* Can interpret Excel formula and arithmetic expre…
Read full description →
This is a spreadsheet focusing on effective and easy entry by using editable keypad (virtual keyboard).
This is the free version with ads. 'QESS pro' is the payed version without ads.
* Can assign cell movement and text entry to one key touch.
* Can edit the layout and action for the keypad.
*Can run without network.
* Can control the key action by using command sequence or JavaScript.
* Can read and write xls, xlsx, csv, tsv and txt.
* Can interpret Excel formula and arithmetic expressions.
* Can acquire text by using QR code and voice recognition.
* Can send and receive the text with 'Share' function.
* Can speak out the text.
* Can set media (Image, Video, Audio) into a cell. The function is realized as the reference of the media file. No compatibility with Excel.
* Can set hand-write image into a cell.
* Can draw line chart, stacked bar chart, group bar chart, pie chart, scatter chart, radar chart, bubble chart, and candlestick chart.
* Can execute SQL Query on specified range.
* Can generate QR code.
* Can split/trim a large spread sheet file to small files.
* Can export data file to the external storage area, and can import from the storage area.
* Can search/replace text indicating simple text or regular expression pattern.
* Can sort rows ascending/descending order of an indicating key column.
* Can freeze pains of up-side rows and left-side columns.
* Can display thumbnail for image and video cell (including http image and Youtube video).
The spreadsheet application is frequently used to fill fixed items with typical values repeatedly.
We developed this application for the purpose of such a use.
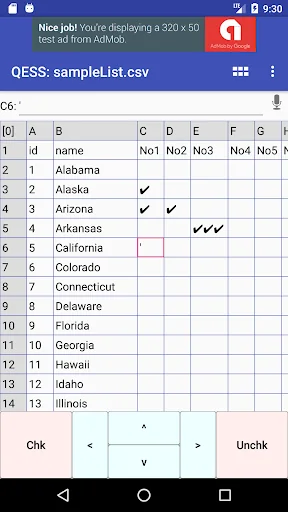
For example, it is useful for attendance check list, evaluation check list, goods management list, event management list, game score list, counting (passing traffic, the attendance, the bird watching), questionnaire input (answers for plural items), cashbook (the record of the amount of money, its purpose and the date), action log.
Various samples are included: Counter, Checking, Scoring, Questionnaire, Calculator with logging, PRN calculator, Voice input, Speak out, QR code input/output and others.
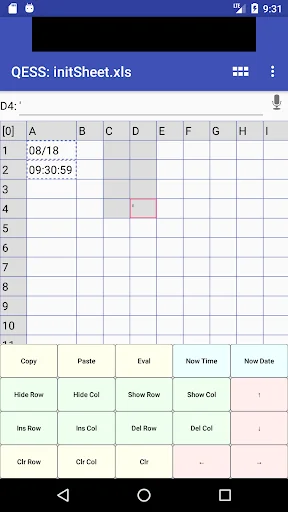
1. The keypad layout and input character sequence can be modified freely.
2. One key touch can be assigned to the entry of plural characters, the jump between cells, calculation of the cell value and others. The action can be controlled with JavaScript.
3. Supported file format are xls, xlsx, csv, tsv and txt. At reading text (csv, tsv, txt), the character encoding can be detected automatically or can be selected manually. Data file is compatible to Excel and other spread sheets.
4. It can execute the Excel formula. It also has a parser of arithmetic expressions.
5. It can copy/paste the cell and cell range. It can send and receive the text by using 'Share' function. Therefore, the user can choose various input methods and applications
such as OCR (optical character recognition).
6. It can hide/unhide/delete/insert columns and rows. It can freeze up/left side cells.
7. It reflects Excel settings about cell border, width, height, font and fill color. But it does not reflect Excel settings about cell merge, chart, image and others (support incompatible chart and image).
8. It has functions for QRcode/barcode input, voice recognition input, and exchanging data with other applications by using file, clipboard, share function, and QRcode. For these functions, it requests permission of camera. If functions are not required, the request can be denied.
9. It can speak out the text in the cell or the cell range by using 'Text to speech (TTS) function. If you register a Speak button in a layout, it is also usable for the communication support of the person who is dysphonia.
10. It includes sample layout files which can be used in various situations and are edited freely.
11. The Help document exists in the following page.
https://qess-free.web.app/en/
The five apps in Productivity with the closest revenue to QESS std. Click any to see its detail page.
Each forecast combines App Store rating, ratings count, monetisation model, pricing tier, IAP signals and ad-supported flag.
The base estimate is then multiplied by a per-category scaling factor learned from apps with founder-verified MRR.
Every number on this page comes from public APIs and bumetric's own snapshot history.
 DYMO Connect
 My Cyta
 Marshall Smart
 hAI by Hacken
 Sketch on PDF