ML revenue forecast.
Calibrated against 48160 apps in this category.
Confidence band
±15%
High — many comparable apps with verified data
At a glance
Earns 2.11× more than the category median (130/mo).
Ranks #5,555 of 48,160 in Business (top 11.5% by revenue).
Launched Jun 11, 2014.
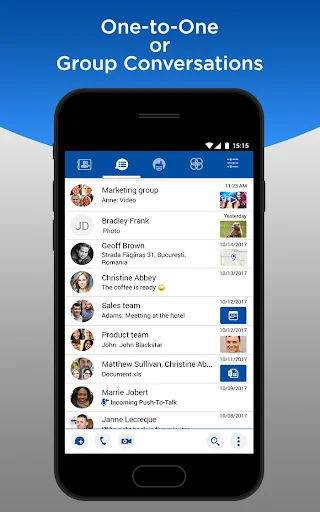
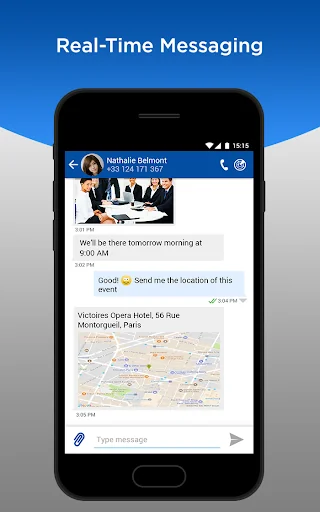
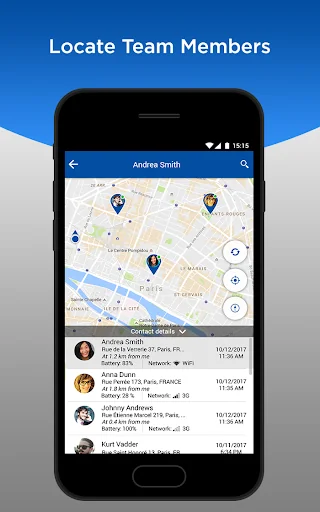
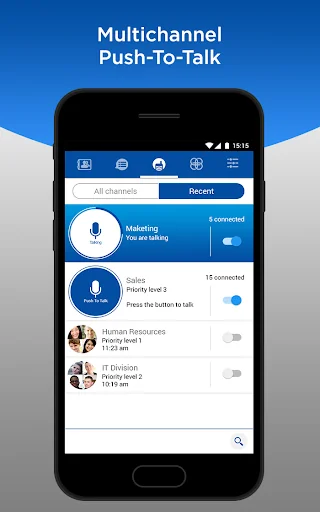
What the app looks like
Live screenshots from the Play Store, captured by our snapshot worker. Tap any image to enlarge.
Team on the Run's revenue trajectory
Forecast revenue from snapshot history. Last 1 months.
Where Team on the Run sits in Business
Revenue distribution of 48160 comparable apps. Team on the Run highlighted.
Team on the Run vs comparable apps
Revenue trajectory side-by-side. Bold = Team on the Run, ghosted = peers.
App spec
Version
Varies with device
Launched
Jun 11, 2014
Price
Free
Monetization
Free
What Team on the Run actually does (from store listing)
With Team on the Run:
- Connect your Teams with your Company private Mobile Messenger
- Save time on mobile-initiated business communications
- Secure your Mobile Business Communications
- Create, Edit and Manage Field Employees from a user-friendly Web Dashboard
Before you download the application, make sure your company has already created an account on www.teamontherun.com. You should have received an invitation from your company administrator including a company ID. Once …
- Connect your Teams with your Company private Mobile Messenger
- Save time on mobile-initiated business communications
- Secure your Mobile Business Communications
- Create, Edit and Manage Field Employees from a user-friendly Web Dashboard
Before you download the application, make sure your company has already created an account on www.teamontherun.com. You should have received an invitation from your company administrator including a company ID. Once download is complete, you will be required this ID as well as your cell phone number to log in.
Mobile Application Features:
- Secure authentication
- Secure communication: messages are encrypted to ensure confidentiality and privacy
- Company address book access (employees and business groups)
- One-to-one Voice calls over IP
- Live Walkie-talkie call or connection to a walkie-Talkie channel to discuss with multiple employees.
- Group messaging: exchange information instantly and get delivery reports to guarantee content reception
- One-to-one or one-to-many conversation
- Multimedia sharing: share pictures, audio and video files to get last meetings decisions or to report a remote site issue
- Document sharing: send documents and files stored on device, hosted on a cloud storage service (ex: DropBox, Google Drive) or on Electronic Content Management system (Alfresco).
- Content sharing: share content directly from third party applications such as a link from a Web Browser or an article from a News application
- Location sharing: see where your colleagues are located
- Calendar and meeting sharing: Inform team members of an important meeting and let them save the date on their calendar!
- Business Contact Sharing: share client or partner’s contact details with your team.
For questions and or support, please contact support@teamontherun.com
Subscribe on www.teamontherun.com and get started in 5 minutes, for Free!
Comparable Android apps
The five apps in Business with the closest revenue to Team on the Run. Click any to see its detail page.
Each forecast combines App Store rating, ratings count, monetisation model, pricing tier, IAP signals and ad-supported flag.
The base estimate is then multiplied by a per-category scaling factor learned from apps with founder-verified MRR.
Every number on this page comes from public APIs and bumetric's own snapshot history.
Full methodology covers input variables, accuracy bands per category and how we treat apps without comparable anchors.
See also the live data on Team on the Run's tracker page for current rating, reviews and snapshot timeline.
Building something similar? Get a free AI audit with $-revenue forecasts for every recommendation.

 Zantrik
 VRM (Victron Energy)
 MyGCI
MyGCI
 iChannel
 EasyMerch