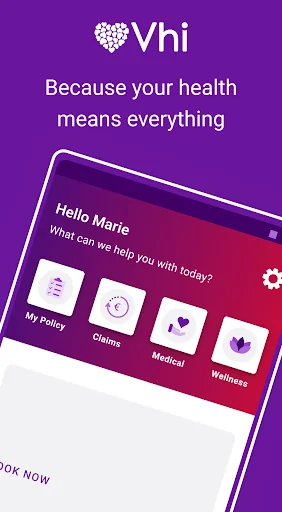
Your Vhi Healthcare team are accessible through the app, making day-to-day health queries quick and seamless.
Whether you need to check the details of your plan or claim back an expense, you can do it easily from our app.
Whenever you need us, we’re there.
Current Features:
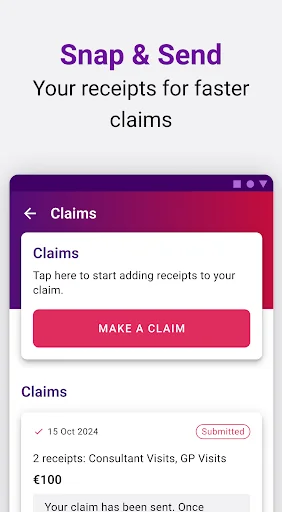
Snap & Send
Claim your everyday medical expenses, anytime, anywhere.
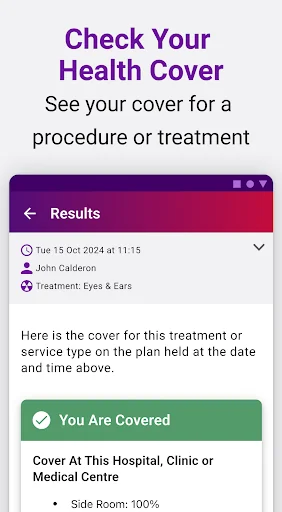
Am I Covered?
Chat directly with an Irish based advisor to have policy, benefits, and claims questions quickly answered.
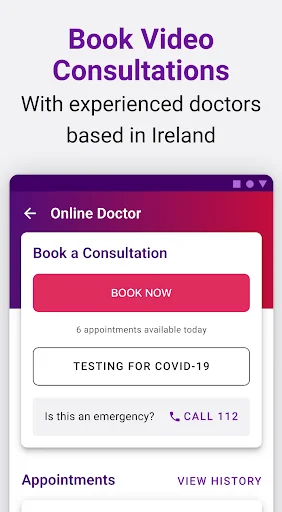
Online Doctor
Fa…
Each forecast combines App Store rating, ratings count, monetisation model, pricing tier, IAP signals and ad-supported flag.
The base estimate is then multiplied by a per-category scaling factor learned from apps with founder-verified MRR.
Every number on this page comes from public APIs and bumetric's own snapshot history.
Full methodology covers input variables, accuracy bands per category and how we treat apps without comparable anchors.
See also the live data on Vhi's tracker page for current rating, reviews and snapshot timeline.
Building something similar? Get a free AI audit with $-revenue forecasts for every recommendation.

 BoneBox™ - Dental Lite
 Blood Pressure Diary
 Mediately Baza Lekova
 GiveBlood
 OptumRx