ML revenue forecast.
Calibrated against 51929 apps in this category.
Confidence band
±15%
High — many comparable apps with verified data
At a glance
Earns 1.59× more than the category median (168/mo).
Ranks #13,459 of 51,929 in Lifestyle (top 25.9% by revenue).
Launched Aug 22, 2015 · last updated Mar 14, 2024.
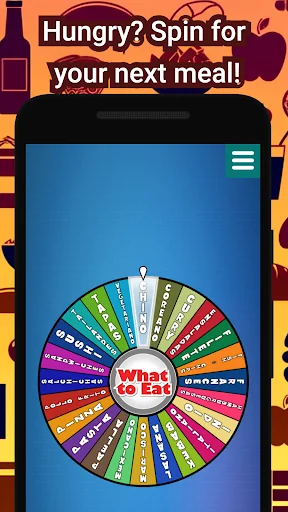
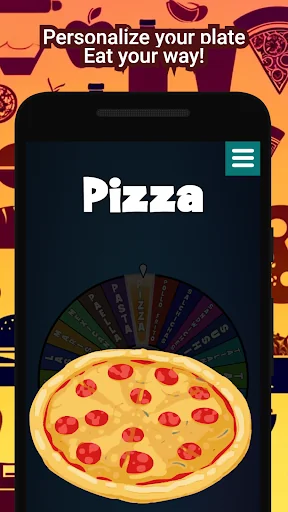
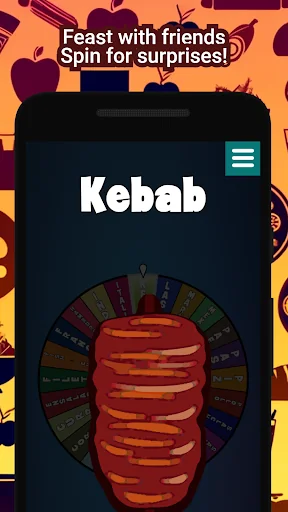
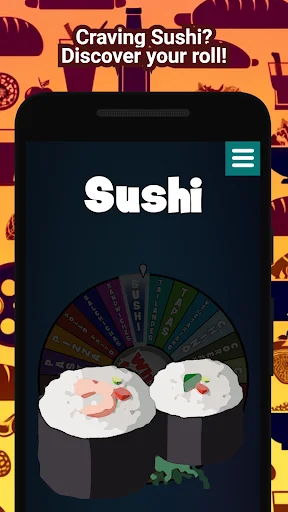
What the app looks like
Live screenshots from the Play Store, captured by our snapshot worker. Tap any image to enlarge.
What to Eat's revenue trajectory
Forecast revenue from snapshot history. Last 1 months.
Where What to Eat sits in Lifestyle
Revenue distribution of 51929 comparable apps. What to Eat highlighted.
What to Eat vs comparable apps
Revenue trajectory side-by-side. Bold = What to Eat, ghosted = peers.
App spec
Version
1.02
Last update
Mar 14, 2024
Launched
Aug 22, 2015
Price
Free
Monetization
Free
What What to Eat actually does (from store listing)
Struggling to decide what to cook or where to dine? 'What to Eat' is your ultimate food decision maker! Simplify your mealtime dilemmas with a fun and interactive spin-the-wheel feature. Get instant suggestions. Whether you're craving Italian, searching for a vegan feast, or in the mood for a quick snack, 'What to Eat' has you covered.
Customize your wheel based on dietary preferences, meal type (breakfast, lunch, dinner, snacks), and cuisine.
Download 'What to Eat' now and make meal dec…
Struggling to decide what to cook or where to dine? 'What to Eat' is your ultimate food decision maker! Simplify your mealtime dilemmas with a fun and interactive spin-the-wheel feature. Get instant suggestions. Whether you're craving Italian, searching for a vegan feast, or in the mood for a quick snack, 'What to Eat' has you covered.
Customize your wheel based on dietary preferences, meal type (breakfast, lunch, dinner, snacks), and cuisine.
Download 'What to Eat' now and make meal decisions fun, fast, and effortless. Say goodbye to mealtime indecision and hello to delicious dining experiences!
Comparable Android apps
The five apps in Lifestyle with the closest revenue to What to Eat. Click any to see its detail page.
Each forecast combines App Store rating, ratings count, monetisation model, pricing tier, IAP signals and ad-supported flag.
The base estimate is then multiplied by a per-category scaling factor learned from apps with founder-verified MRR.
Every number on this page comes from public APIs and bumetric's own snapshot history.
Full methodology covers input variables, accuracy bands per category and how we treat apps without comparable anchors.
See also the live data on What to Eat's tracker page for current rating, reviews and snapshot timeline.
Building something similar? Get a free AI audit with $-revenue forecasts for every recommendation.

 Yerba Mate
 도그마루 보호소 - 강아지입양 고양이입양 유기동물보호소
 鼎泰豐
鼎泰豐
 Live Darshan
 uniColor