What Where's My Water? actually does (from store listing)
Get the GAME OF THE YEAR award-winning puzzler!
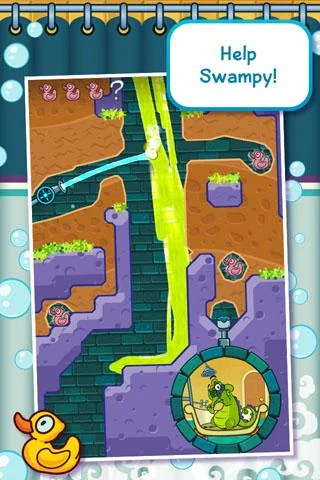
Help Swampy by guiding water to his broken shower. Each level is a challenging physics-based puzzle with amazing life-like mechanics. Cut through dirt to guide fresh water, dirty water, toxic water, steam, and ooze through increasingly challenging scenarios! Every drop counts!
• Original Stories & Characters – Play through 4 unique stories featuring Swampy, Allie, Cranky and Mystery Duck. That’s over 500 amazing puzzles!
• Innovative Mechanic …
Help Swampy by guiding water to his broken shower. Each level is a challenging physics-based puzzle with amazing life-like mechanics. Cut through dirt to guide fresh water, dirty water, toxic water, steam, and ooze through increasingly challenging scenarios! Every drop counts!
• Original Stories & Characters – Play through 4 unique stories featuring Swampy, Allie, Cranky and Mystery Duck. That’s over 500 amazing puzzles!
• Innovative Mechanic – See water in various forms and use your creativity to solve the puzzles – totally stimulating!
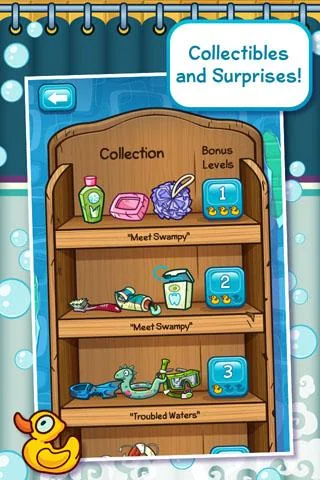
• Collectibles, Challenges, and Bonus Levels – Collect special items uniquely designed for each character and complete cool challenges to unlock bonus levels! “Tri-Duck” each level for ultimate bragging rights!
SWAMPY’S STORY
Swampy the Alligator lives in the sewers under the city. He’s a little different from the other alligators – he’s curious, friendly, and loves taking a nice long shower after a hard day at work. But there’s trouble with the pipes and Swampy needs your help getting water to his shower!
ALLIE’S STORY
Allie is the sewer's most creative alligator. Her quirky spirit and artistic talents made her a star. Now, the gators have crafted a one-of-a-kind steam-powered musical instrument, and can't wait to hear her play it! Help Allie get the steam she needs and enjoy her take on classic Disney tunes.
CRANKY’S STORY
Cranky, a real gator’s gator, has a big appetite and will eat anything, from tires to old fish bones. But he refuses to eat his greens! Use the dirty purple water to clear the algae on Cranky’s plate so he can gobble up his “food”.
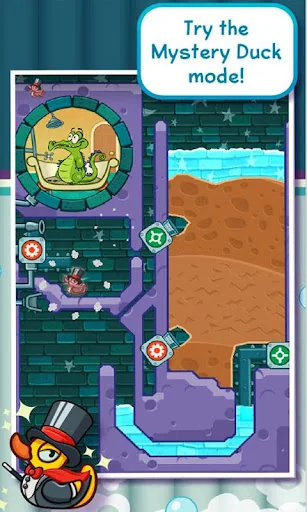
MYSTERY DUCK
Catch this fancy teleporting Mystery Duck in this special chapter and hint - timing is everything! Find all kinds of surprises including the biggest duck ever, MegaDuck and cute little Ducklings!
Some stories may require a small additional price but try the FREE levels today!
Before you download this experience, please consider that this app contains social media links to connect with others, in-app purchases that cost real money, as well as advertising for The Walt Disney Family of Companies and some third parties. In App Purchases from $0.99-$4.99
Visit the official Where's My Water? website – http://lol.disney.com/games/wheres-my-water-app
Privacy Policy - https://privacy.thewaltdisneycompany.com/
Terms of Use - https://disneytermsofuse.com/
Your California Privacy Rights - https://privacy.thewaltdisneycompany.com/en/current-privacy-policy/your-california-privacy-rights/
Do Not Sell My Info - https://privacy.thewaltdisneycompany.com/en/dnsmi/
Children’s Online Privacy Policy - https://privacy.thewaltdisneycompany.com/en/for-parents/childrens-online-privacy-policy/
Comparable Android apps
The five apps in Puzzle with the closest revenue to Where's My Water?. Click any to see its detail page.
Each forecast combines App Store rating, ratings count, monetisation model, pricing tier, IAP signals and ad-supported flag.
The base estimate is then multiplied by a per-category scaling factor learned from apps with founder-verified MRR.
Every number on this page comes from public APIs and bumetric's own snapshot history.
Full methodology covers input variables, accuracy bands per category and how we treat apps without comparable anchors.
See also the live data on Where's My Water?'s tracker page for current rating, reviews and snapshot timeline.
Building something similar? Get a free AI audit with $-revenue forecasts for every recommendation.
 The Room Two
 Monument Valley
 The Room
 The Room Three
 Monument Valley 2