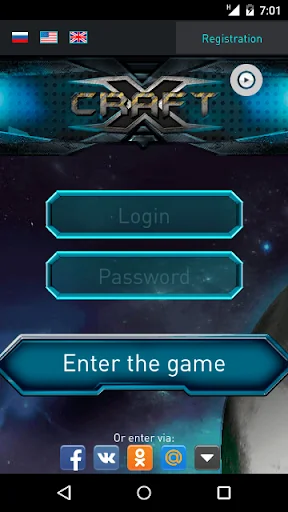
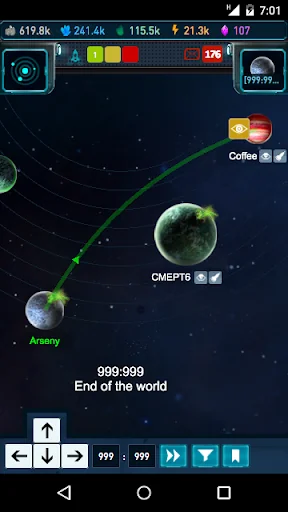
Can you feel it? The majestic vastness of the universe, space and a one-of-a-kind infinite world. Welcome to a planet of your own! In our space strategy you can create an empire, colonizing worlds within the Coprau sector and beyond.
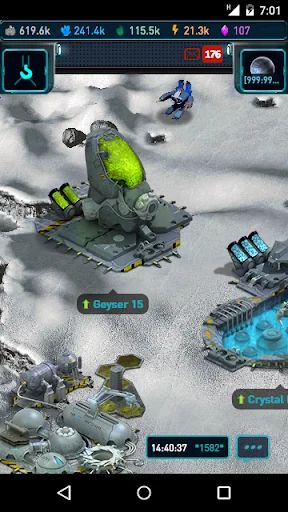
Flotillas of ships of the future, raids on alien planets, riddles of the void, mysteries of civilizations. Be strong, be brave and wise ruler. Build a huge fleet and one day spread your wings and lead the sector.
Start your own saga of intergalactic wars betwe…
Can you feel it? The majestic vastness of the universe, space and a one-of-a-kind infinite world. Welcome to a planet of your own! In our space strategy you can create an empire, colonizing worlds within the Coprau sector and beyond.
Flotillas of ships of the future, raids on alien planets, riddles of the void, mysteries of civilizations. Be strong, be brave and wise ruler. Build a huge fleet and one day spread your wings and lead the sector.
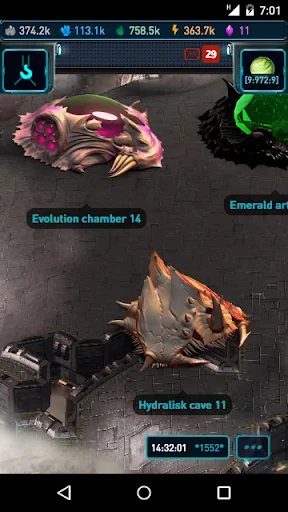
Start your own saga of intergalactic wars between Xerjs, Tosses and Posthumans. Against a backdrop of impressive battles, a gripping story unfolds before you, full of intrigue, treachery, betrayal and fanatical loyalty, where the action is dynamic, evil is invincible, and allies die at the hands of traitors...
Comparable Android apps
The five apps in Strategy with the closest revenue to Xcraft. Click any to see its detail page.
Each forecast combines App Store rating, ratings count, monetisation model, pricing tier, IAP signals and ad-supported flag.
The base estimate is then multiplied by a per-category scaling factor learned from apps with founder-verified MRR.
Every number on this page comes from public APIs and bumetric's own snapshot history.
Full methodology covers input variables, accuracy bands per category and how we treat apps without comparable anchors.
See also the live data on Xcraft's tracker page for current rating, reviews and snapshot timeline.
Building something similar? Get a free AI audit with $-revenue forecasts for every recommendation.

 Empire at War 2
 Peninsular War Battles
 Your Land. WHAT?!
 Tower Defense Kingdom Realm
 LordsWM Mobile