There are stages of differing tasks that are to be completed. Grabbing money bags, performing dangerous tricks, avoiding enemies, completing stages, etc., earns you points. After the fifth stage is completed, the game starts over again but with flying birds and more difficult (but exactly the same in terms of task to be completed) levels.
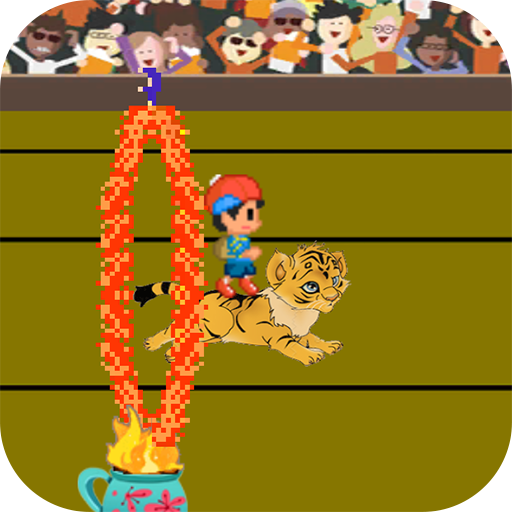
Stage 1: Ride on a lion and jump through flaming rings
Stage 2: Tightrope walking whilst jumping over monkeys
Stage 3: Jump from ball to ball
Stage 4: R…
There are stages of differing tasks that are to be completed. Grabbing money bags, performing dangerous tricks, avoiding enemies, completing stages, etc., earns you points. After the fifth stage is completed, the game starts over again but with flying birds and more difficult (but exactly the same in terms of task to be completed) levels.
Stage 1: Ride on a lion and jump through flaming rings
Stage 2: Tightrope walking whilst jumping over monkeys
Stage 3: Jump from ball to ball
Stage 4: Ride a horse and jump over trampolines and walls
Stage 5: Trapeze
You also races against time. Bonus points are awarded according to the time remaining, but running out of time will cost the player a life.
You will get an extra live every 20000 points.
Have fun !
Comparable Android apps
The five apps in Arcade with the closest revenue to Circus. Click any to see its detail page.
Each forecast combines App Store rating, ratings count, monetisation model, pricing tier, IAP signals and ad-supported flag.
The base estimate is then multiplied by a per-category scaling factor learned from apps with founder-verified MRR.
Every number on this page comes from public APIs and bumetric's own snapshot history.
Full methodology covers input variables, accuracy bands per category and how we treat apps without comparable anchors.
See also the live data on Circus's tracker page for current rating, reviews and snapshot timeline.
Building something similar? Get a free AI audit with $-revenue forecasts for every recommendation.


 God Of Pranks
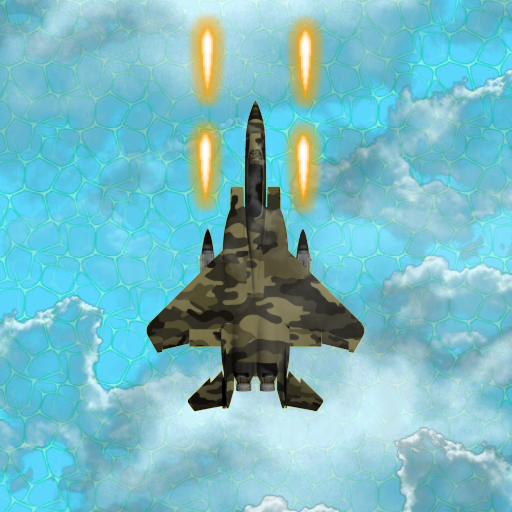 Aircraft Wargame Touch Edition
 Knife.io
 rock kong D.K.
 Papi Drive