What if every phone unlock made your day just a little better? Imagine unlocking in the morning, and the weather is already there.
Imagine unlocking while you’re waiting in line or at work, and there’s already a beautiful photo gallery waiting to help you relax and escape the grind. Or maybe, for you, it’ll be local events that’ll make you look forward to your downtime, or just the top headlines in news, sports or entertainment to stay informed.
We call them “smart” phones; shouldn’t we ex…
What if every phone unlock made your day just a little better? Imagine unlocking in the morning, and the weather is already there.
Imagine unlocking while you’re waiting in line or at work, and there’s already a beautiful photo gallery waiting to help you relax and escape the grind. Or maybe, for you, it’ll be local events that’ll make you look forward to your downtime, or just the top headlines in news, sports or entertainment to stay informed.
We call them “smart” phones; shouldn’t we expect more from them? Get more from those little moments in between, when you unlock your phone.
Unlock the power of theSCOOP today!
Comparable Android apps
The five apps in Entertainment with the closest revenue to theSCOOP. Click any to see its detail page.
Each forecast combines App Store rating, ratings count, monetisation model, pricing tier, IAP signals and ad-supported flag.
The base estimate is then multiplied by a per-category scaling factor learned from apps with founder-verified MRR.
Every number on this page comes from public APIs and bumetric's own snapshot history.
Full methodology covers input variables, accuracy bands per category and how we treat apps without comparable anchors.
See also the live data on theSCOOP's tracker page for current rating, reviews and snapshot timeline.
Building something similar? Get a free AI audit with $-revenue forecasts for every recommendation.


 Truth Or Dare 2 - Chat Party
 Huwi: Boost Likes
 IGN Entertainment
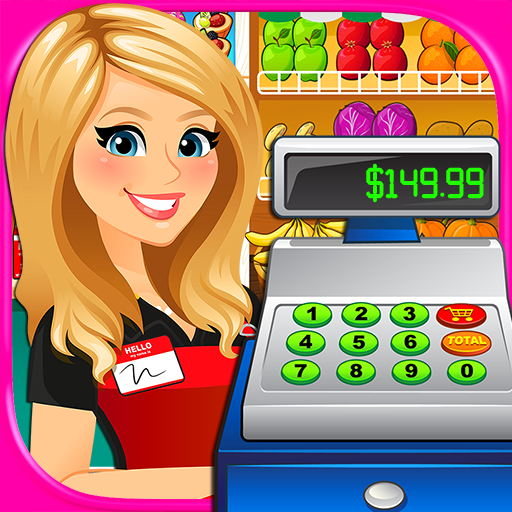 Supermarket Grocery Superstore
 TV Guide Italy