What Tama Planets actually does (from store listing)
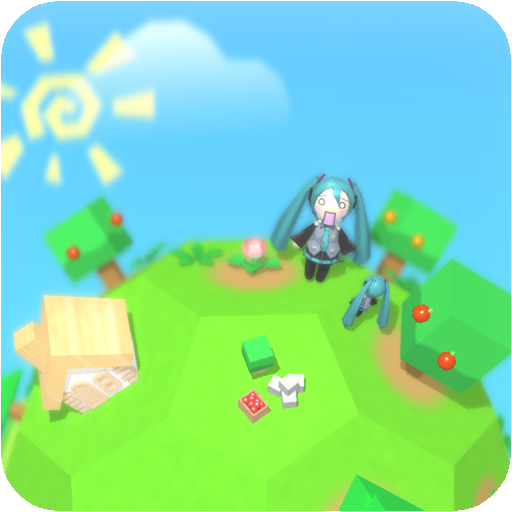
This application is a miniscape game with a loose nature. At first there are not many things that you can do, so please take your time and take care of it with patience.
[How to play]
There are lots of mysteries on this planet.
At first you have nothing. What you can do is also limited.
When you get something, plant them.
Water them to let them grow more and more.
When you are at a loss what to do, click on the pond.
You may get a useful item.
[Permission]
WRITE_EXTERNAL_STORAGE,R…
This application is a miniscape game with a loose nature. At first there are not many things that you can do, so please take your time and take care of it with patience.
[How to play]
There are lots of mysteries on this planet.
At first you have nothing. What you can do is also limited.
When you get something, plant them.
Water them to let them grow more and more.
When you are at a loss what to do, click on the pond.
You may get a useful item.
[Permission]
WRITE_EXTERNAL_STORAGE,READ_EXTERNAL_STORAGE: Save & Load game data.
INTERNET: Backup to the cloud.
BILLING: In-app Billing. (Extending the item pack.)
[Thanks]
Everyone in the community was immediately raised Miku Yune, We sincerely thank the designer as you provide a data model.
Comparable Android apps
The five apps in Casual with the closest revenue to Tama Planets. Click any to see its detail page.
Each forecast combines App Store rating, ratings count, monetisation model, pricing tier, IAP signals and ad-supported flag.
The base estimate is then multiplied by a per-category scaling factor learned from apps with founder-verified MRR.
Every number on this page comes from public APIs and bumetric's own snapshot history.
Full methodology covers input variables, accuracy bands per category and how we treat apps without comparable anchors.
See also the live data on Tama Planets's tracker page for current rating, reviews and snapshot timeline.
Building something similar? Get a free AI audit with $-revenue forecasts for every recommendation.


 Memory Color - Brain training
 Pizza Burger - Cooking Games
 BUMSUFF!
 Talking Dinosaur
 Arashi FREE