1.2M Android Apps Tracked Updated 3 min ago Revenue Forecasts
Add an app Create Account Sign In
Home

Sony LIV: Series, Shows, Movie

69
Quality Score
Solid

Sony LIV: Series, Shows, Movie

High confidence
3.3 ✍️ Editor
✍️ bumetric analysis

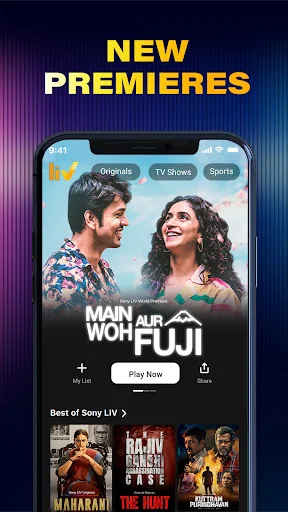
Sony LIV carves out a specific niche within the entertainment streaming sector, targeting the South Asian diaspora in the USA with its exclusive library of Indian series, movies, and TV shows. Its direct competitors include other regional content providers like Hotstar and Eros Now, as well as mainstream platforms that license South Asian content. With nearly two million ratings, the app demonstrates significant traction and a substantial user base, suggesting it’s a mature product in a growth stage, having successfully acquired a large audience. The average rating indicates there's room for improvement in user experience or content satisfaction, which could impact retention. Given its free monetization model, Sony LIV likely relies on a subscription upsell for premium content. In this category, a common monetization observation is the effectiveness of tiered subscription models, offering a free, ad-supported tier to attract users and then converting them to ad-free or premium content subscriptions, often with annual discounts to boost lifetime value.

BU Score 69 · Solid — established niche player. The full Investment Matrix below scores 8 dimensions including monetisation, growth, and operational risk.

Track snapshot history and revenue forecast in the Performance section below.

💰 Monthly revenue · now vs forecast
● Right now
$5.2K
per month
12-mo forecast
$5.4K – $11.3K
per month
24-mo forecast
$6.7K – $20.1K
per month
MID tier
💡 Grow this revenue
Free AI audit of this app’s store listing
  • Title & subtitle keyword fit
  • Description hook & conversion structure
  • Screenshots, ratings, reviews strategy
Run free AI audit →
Typical impact: +2-5× organic installs
🔔Notify me when this app's revenue changes by

📊 Performance Tracking LIVE

Loading…
idle
0%
Rating
Reviews
Forecast Revenue / mo
Snapshots tracked
0
since first record
ONE-TIME · BUILD 💰 Estimated build cost
$100K
What it cost to build · not monthly revenue
Likely range $75K – $135K
$25K · MVP floor $100K · indie scale $500K+ · studio build
📈 Pays back in ~1.6y at current MRR

Synthetic estimate. Inputs: category complexity, file size, screen count, monetization layer, platform reach, age × team-size proxy. Calibrated against 2024-2026 indie-agency rate surveys. Full math + source list on /methodology.

Where the money goes
🧱 MVP baseline (design + 1-store ship) +$28K
📱 5 unique screens × $4.5K +$22K
Entertainment complexity ×1.30 +$15K
🌐 Cross-platform reach (iOS + Android) +$36K
Total estimate $100K
ONE-TIME · EXIT VALUE 💵 Estimated acquisition value
$75K
What it would sell for · not monthly revenue
Marketplace range $50K – $75K · 13× MRR multiple
💸 ~0.8× build cost (under-water)

Synthetic estimate. Multiple band derived from ad-supported + age, rating quality, category demand, and user-base maturity. Calibrated against 2024-2026 indie-app-marketplace closed-deal medians. Full math + comparable deal list on /methodology.

How the multiple was built
📺 Ad-supported base 15× MRR
★ rating < 3.5 (weak) -18%
🏷 Entertainment category multiple -5%
Mature user base (1M+ ratings) +8%
Final multiple 13× MRR
👥 Estimated audience size
295.5M
Lifetime downloads (US-equivalent)
Monthly active
35.0M
Daily active
14.0M

Synthetic estimate from ratings × category benchmarks. Calibrated against 2024-2026 mobile-attribution retention + DAU/MAU reports. Numbers are US-storefront-equivalent — true global audience can be 5-10× larger for international apps. Full math + source list on /methodology.

How we sized it
📲 Entertainment engagement ~150 installs / rating
🔁 Entertainment D30 retention 12%
📍 DAU / MAU stickiness 0.40
DAU / MAU 40% sticky
🛠 Estimated tech stack
🤖
Native Android (Kotlin)
High confidence · 80%
Also possible
Flutter

Heuristic guess from app bundle size, category, store description signals, and release-date stack era. Bumetric does not disassemble binaries — for binary-level certainty you would need an SDK intelligence tool or the manifest itself. Reasoning chain on the right. Full ruleset on /methodology.

Signals we read
🏷 Category context Entertainment
📦 Compact Android bundle → Native Kotlin
🔬

How we forecast this revenue

MEDIUM CONFIDENCE
Baseline
$5.2K/mo · ML-estimated from 234 triggers
Growth rate
+4.0% MoM · MID tier baseline (compound monthly)
Direction
Headwinds: low defensibility moat
6 months
$5.0K – $8.3K
12 months
$5.4K – $11.3K
24 months
$6.7K – $20.1K
Compound growth at +4.0% MoM (tier baseline for MID). Range widens with horizon — typical noise band ±25% at 6mo.. Ranges widen with horizon — distant futures carry more uncertainty.
📊

BU Investment Matrix

Stalled · 39/100MID TIERno growth momentum
GrowthFounderQualityRevenueMonetiz.MoatMarketSafety
Growth Velocity
5.0
Founder Strength
4.7
Product Quality
6.6
Revenue Strength
3.7
Monetization Maturity
1.0
Defensibility
2.0
Market Position
0.0
Operational Safety
8.0
  • 💰 Revenue: Modest — $3K - $7K/mo · MID tier · medium confidence, trajectory unclear.
  • ⭐ Quality: 3.3★ across 1,973,177 reviews — solid.
  • 📍 Market: Not yet charting in any of the 9 monitored markets.
  • 📈 Growth: Insufficient signal to assess trajectory.
  • ⚠️ Risk: Moderate — no material risk signals detected.
🎯 For competitors: Mixed picture. Worth competing if you have a clear UX or pricing edge — otherwise crowded segment.
💵 For acquirers: Estimated asking range 18-32× monthly = $94K-$167K.
Composite of 8 dimensions computed deterministically from public signals — no LLM, every score traces back to a measurable input. Default weights shown; "compete" / "acquire" / "invest" lenses re-weight without re-fetching.
Range:

💰 Forecast Revenue / mo

MODEL
Revenue forecast computed from BU's 234 trigger model on each snapshot. Calibrated against ground-truth from 58 verified-revenue apps.
🔬Forecast Breakdown — Why This Estimate?Top 3 of 3 triggers
Our ML model uses 200+ signals from public data. These are the most influential for this app:
High install base (1,973,177 ratings)METRIC
+$12,000
Below-average rating (3.3★)METRIC
−$1,500
Ad-supported / freemiumMETRIC
+$600
METRIC = structural app data · REVIEW = mined from user reviews · ✓ VERIFIED = Stripe-verified anchor (TrustMRR)

📈 Reviews Growth

LIVE
Cumulative review count from first BU snapshot. Each point = a tracked update.

⭐ Rating Trend

LIVE
Average rating evolution. Updates with each new review batch.

Profile & Insights

Everything we know — and don't — about this app and its company.

Identification

App name
Sony LIV: Series, Shows, Movie
Developer
Culver Max Entertainment Private Limited
Bundle ID
com.sonyliv
App Store URL
Open in App Store
Category
Entertainment
Content rating
Not found
Languages
Not found

Company

Website
Not found
Tagline
Not found
Description
Not found
Founded
Not found
HQ / Address
Not found
Employees
Not found
Logo
Not found

Revenue

Verified revenue / mo
Not found
AI revenue estimate / mo
$500.0K ($425.0K – $575.0K)AI medium
AI annual estimate
$6.0M/yr
ML model estimate / mo
$5.2K/mo
Top-grossing rank
Not found
All-time revenue
Not found
Pricing
Not found

Founder

Founder data not yet collected for this app.

Funding

Funding data not yet collected for this app.

Press & Links

Press & Links data not yet collected for this app.

Contacts & Socials

Contacts & Socials data not yet collected for this app.
AI Revenue EstimateCONFIDENCE: MEDIUM
The Android app "Sony LIV: Series, Shows, Movie" is estimated to generate approximately $500,000 in monthly revenue, based on Sensor Tower data for April 2026 in India. This translates to an estimated annual revenue of $6 million.
Sources mentioned: Sensor Tower, Culver Max Entertainment Private Limited
Profile is built from iTunes Lookup + developer site scrape + ML revenue model. Empty fields show "Not found" — additional sources (Crunchbase, X, IndieHackers, Acquire.com) coming.

📝 About this app

<h3>Looking for a one-stop destination for Original Web Series, Exclusive TV shows, and Trending Movies in the USA?</h3>
Don't worry. A Universe of South Asian Entertainment Awaits You on Sony LIV!

Sony LIV is your go-to streaming OTT platform with a vast collection of Series, Latest Movies and Indian TV Shows. Subscribe to Sony LIV for access to entertainment from thrilling action-packed films to heartwarming dramas. Discover a diverse range of Indian Movies and series, plus more must-watch and award winning content in various genres!

<h5><b>With Sony LIV, you can enjoy:</b></h5>… View full description on the official store →
App Specs
🔐 Own this app? Claim & verify MRR →
🔖 vVaries with device🔄 updated 0d ago📂 Entertainment💰 Free
🔔

Track this app’s revenue

FREE
Get an email when revenue moves by your threshold. No spam, unsubscribe in one click.

📝 Description

95
BU Score · Transcendent
Full revenue analysis
Read the article-style breakdown for Sony LIV: Series, Shows, Movie: category rank, percentile, growth signal, comparable apps, and how the forecast is calibrated against verified-MRR anchors in this niche.
Read deep-dive →

Similar apps in Entertainment

About this analysis
ZCAnalyzed by Zakhar Chumak · founder, bumetric·Full methodology·High confidence

Why high confidence: 1,973,177 ratings · no founder-verified revenue (model estimate only).

Frequently Asked Questions

4 answers · auto-generated from this app's public data
How much does Sony LIV make per month?
Based on our ML-calibrated revenue forecast, Sony LIV earns approximately $5.2K/mo. This is a US-storefront-equivalent estimate; global revenue can be several times larger for internationally-distributed apps. See the methodology page for the full formula and confidence bands.
What apps are like Sony LIV?
Browse the full Entertainment category catalog to find similar apps with revenue, build cost, audience and tech stack data. Each /p/{slug} page also shows a Compare side-by-side widget with three peer apps from the same niche.
Who makes Sony LIV?
Sony LIV is published by Culver Max Entertainment Private Limited on the Google Play Store. See the full publisher portfolio (other apps by the same developer) via the More by developer block on the product page above.
What is Sony LIV's BU Score?
Sony LIV has a BU Score of 69/100 (Solid). The score combines App Store rating, ratings count, monetization model and revenue signals calibrated against founder-verified MRR anchors. See the BU Score formula.