 52
52

Quality Score
Solid

Stock Trender


✍️ bumetric analysis
“
Stock Trender is an iOS app from CYPHR LLC in the Finance category, currently rated 5.0★ across 2 ratings. Initial signal reads as mostly critical sentiment so far: users flag rough edges and unmet expectations.
Quality Score is 52: Solid (established niche player). For a Finance app, that means established niche player. The full BU Investment Matrix below scores 8 dimensions including monetisation, growth, and operational risk.
Track changes month-over-month in the Performance section below: live snapshot history and revenue forecast included.
💰 Revenue · today and ahead
Today
$882/mo
In 12 months
$772 – $2782
In 24 months
$715 – $6435
INDIE tier
💡 Grow this revenue
Free AI audit of this app’s store listing
- Title & subtitle keyword fit
- Description hook & conversion structure
- Screenshots, ratings, reviews strategy
Typical impact: +2-5× organic installs
📊 Performance Tracking LIVE
Loading…
Rating
—
Reviews
—
Forecast Revenue / mo
—
Snapshots tracked
0
since first record
🔬
How we forecast this revenue
LOW CONFIDENCEBaseline
$882/mo · ML-estimated from 234 triggers
Growth rate
+6.0% MoM · INDIE tier baseline (compound monthly)
Direction
Headwinds: rating drift may slow acquisition
6 months
$752 – $1.8K
12 months
$772 – $2.8K
24 months
$715 – $6.4K
Compound growth at +6.0% MoM (tier baseline for INDIE). Range widens with horizon — typical noise band ±40% at 6mo.. Ranges widen with horizon — distant futures carry more uncertainty.
📊
BU Investment Matrix
Pre-traction · 37/100INDIE TIERlimited signalRevenue Strength
2.9
Product Quality
4.0
Market Position
2.0
Growth Velocity
5.0
Defensibility
4.5
Operational Safety
7.0
Founder Strength
2.9
Monetization Maturity
1.0
- 💰 Revenue: Marginal — $353 - $2207/mo · INDIE tier · medium confidence, trajectory unclear.
- ⭐ Quality: 5.0★ across 2 reviews — weak — significant quality concerns.
- 📍 Market: Not yet charting in any of the 9 monitored markets.
- 📈 Growth: ⚠ last update 615d ago — possibly dormant.
- ⚠️ Risk: Moderate — dormant (615d since update).
🎯 For competitors: Mixed picture. Worth competing if you have a clear UX or pricing edge — otherwise crowded segment.
💵 For acquirers: Estimated asking range 18-32× monthly = $15K-$28K.
Composite of 8 dimensions computed deterministically from public signals — no LLM, every score traces back to a measurable input. Default weights shown; "compete" / "acquire" / "invest" lenses re-weight without re-fetching.
🌍
Multi-Country Performance
Available in 9 of 9 monitored markets| Market | Rating | Reviews | Current version |
|---|---|---|---|
| 🇺🇸 US | 5★ | 2 | 5★ this version |
| 🇬🇧 GB | 0★ | 0 | — |
| 🇩🇪 DE | 0★ | 0 | — |
| 🇫🇷 FR | 0★ | 0 | — |
| 🇯🇵 JP | 0★ | 0 | — |
| 🇨🇦 CA | 0★ | 0 | — |
| 🇦🇺 AU | 0★ | 0 | — |
| 🇧🇷 BR | 0★ | 0 | — |
| 🇮🇳 IN | 0★ | 0 | — |
Range:
💰 Forecast Revenue / mo
MODELRevenue forecast computed from BU's 234 trigger model on each snapshot. Calibrated against ground-truth from 58 verified-revenue apps.
🔬Forecast Breakdown — Why This Estimate?Top 5 of 5 triggers
Our ML model uses 200+ signals from public data. These are the most influential for this app:
| Paid app ($0.00)METRIC | +$2,800 | |
| Excellent rating (5.0★)METRIC | +$2,200 | |
| Mature app (10y old)METRIC | +$1,500 | |
| Single-language (English only)METRIC | −$400 | |
| Pre-traction phase (2 ratings)METRIC | −$300 |
METRIC = structural app data · REVIEW = mined from user reviews · ✓ VERIFIED = Stripe-verified anchor (TrustMRR)
📈 Reviews Growth
LIVECumulative review count from first BU snapshot. Each point = a tracked update.
⭐ Rating Trend
LIVEAverage rating evolution. Updates with each new review batch.
App Specs
🔐 Own this app? Claim & verify MRR →💾 3 MB🔞 4+📱 iOS 11.0+🔖 v3.4🔄 updated 1y ago🌐 EN📂 Finance💰 Paid🚀 Launched 2015 (10y old)
📝 About this app
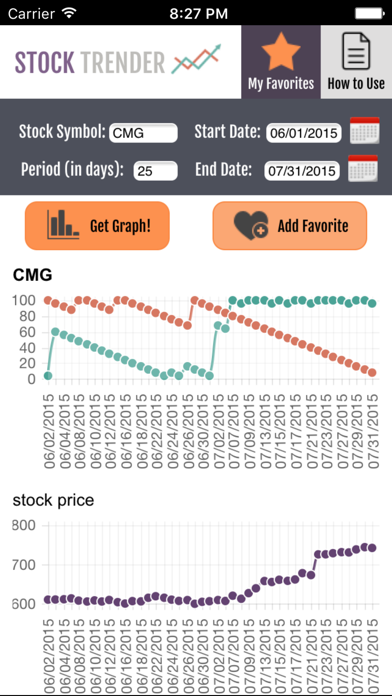
It's like having a personal stock advisor giving you tips on when to buy or sell!
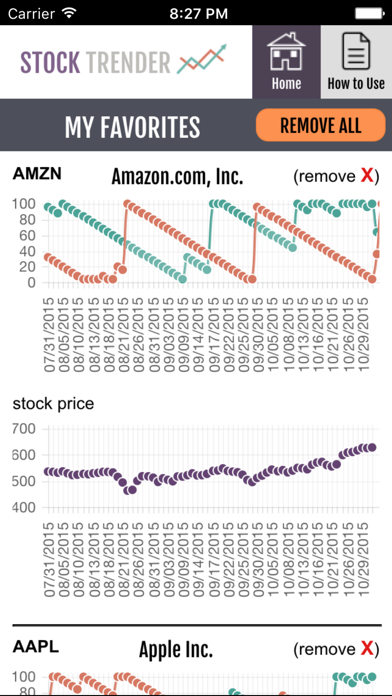
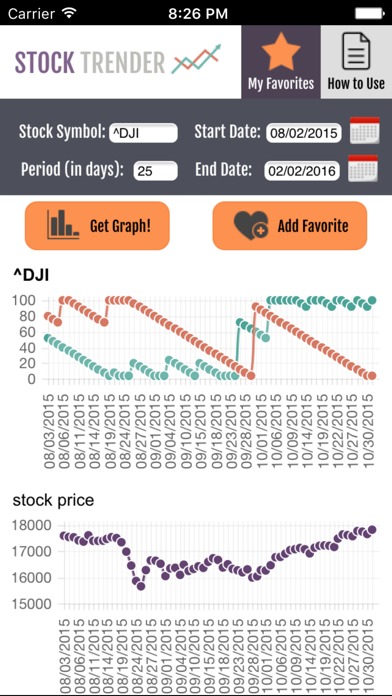
Using easy to read graphs, you'll be able to quickly spot stock trends:
It uses a time tested formula to statistically predict the best time to buy or sell a stock, or get in or out of the market in general.
The formula calculates how the stock is trending. The green line displays how likely it is to continue to rise. The red line predicts how likely it is to continue to fall.
The key is to buy when the green line jumps to 100 AND crosses the red line… View full description on the official store →
🆕 What's New · v3.4
v3.4
- Ads removed!
- Stock data transitioned to using new API
- API calls are now rate limited
- Error Message when too many requests hit
- Added 1 month option
- Ads removed!
- Stock data transitioned to using new API
- API calls are now rate limited
- Error Message when too many requests hit
- Added 1 month option
Profile & Insights
Everything we know — and don't — about this app and its company.
Identification
- App name
- Stock Trender
- Developer
- CYPHR LLC
- Bundle ID
- com.cyphrllc.stocktrender
- App Store URL
- Open in App Store
- Category
- Finance
- Content rating
- 4+
- Languages
- EN
Company
- Website
- www.stocktrenderapp.com
- Tagline
- It's like having a personal stock advisor
- Description
- Not found
- Founded
- Not found
- HQ / Address
- Not found
- Employees
- Not found
- Logo
- Not found
Revenue
- Verified revenue / mo
- Not found
- AI revenue estimate / mo
- Not found
- AI annual estimate
- Not found
- ML model estimate / mo
- $86/mo
- Top-grossing rank
- Outside top 100 in US Finance
- All-time revenue
- Not found
- Pricing
- Not found
Founder
Founder data not yet collected for this app.
Funding
Funding data not yet collected for this app.
Press & Links
Press & Links data not yet collected for this app.
Contacts & Socials
Contacts & Socials data not yet collected for this app.
⭐Recent App Store Reviews4 latest · avg 3.5★ · 50.0% 5★ · 25.0% 1★
5★2 (50%)
4★0 (0%)
3★1 (25%)
2★0 (0%)
1★1 (25%)
+0 ratings/week
Praise: best ×1 love ×1 great ×1
Top positive
★★★☆☆ How does this app work?
The user gui looks ok and the concept seems interesting. 2 star is for following reasons:
A. Can't figure out how to predict the trend in the future. No matter what end date to be set, the latest date to be shown in chart is today. If …
★★★★★ Invaluable!
Absolutely the best visual tool for a trader I've found to date for a quick view on how my stocks are trending! No other platform has provided such an easy to read, visual readout of exactly where my stock stands at any given movement.…
Top negative
★☆☆☆☆ Worthless
I tried several different tickers and not one trade was generated. Avoid this app…
★★★☆☆ How does this app work?
The user gui looks ok and the concept seems interesting. 2 star is for following reasons:
A. Can't figure out how to predict the trend in the future. No matter what end date to be set, the latest date to be shown in chart is today. If …
📈Ratings growth2 ratings+100% lifetimeShow 3-year history estimate ▾
Tracked (6 weeks) Pre-tracking estimate (37 weeks) · model-based, ±5% noise · anchored to release date and current value
🌍Geographic ReachNot ranked
This app is currently outside the top 100 grossing in all 9 countries we monitor (US, UK, DE, FR, JP, CA, AU, BR, IN). Niche or new apps often launch this way — popularity rankings appear once daily revenue clears the regional threshold.
Profile is built from iTunes Lookup + developer site scrape + ML revenue model. Empty fields show "Not found" — additional sources (Crunchbase, X, IndieHackers, Acquire.com) coming.


Full revenue analysis
Read the article-style breakdown for Stock Trender: category rank, percentile, growth signal, comparable apps, and how the forecast is calibrated against verified-MRR anchors in this niche.