1.4M Android Apps Tracked Updated 3 min ago Revenue Forecasts
Add an app Create Account Sign In
Home

B&B HOTELS

70
Quality Score
Strong

B&B HOTELS

by B&B HOTELS
High confidence
4.7 Google Play rating
✍️ Bumetric analysis
“

B&B HOTELS is an Android app from B&B HOTELS in the Travel & Local category, currently rated 4.7★ across 46,656 ratings. Initial signal reads as largely positive sentiment, users highlighting consistency and feature depth.

Quality Score is 70: Strong (healthy traction). For a Travel & Local app, that means healthy traction. The full BU Investment Matrix below scores 8 dimensions including monetisation, growth, and operational risk.

Track changes month-over-month in the Performance section below: live snapshot history and revenue forecast included.

💰 Monthly revenue · now vs forecast
● Right now
$5.0K
per month
→
12-mo forecast
$5.2K – $10.8K
per month
→
24-mo forecast
$6.4K – $19.2K
per month
MID tier
💡 Grow this revenue
Free AI audit of this app’s store listing
  • Title & subtitle keyword fit
  • Description hook & conversion structure
  • Screenshots, ratings, reviews strategy
Run free AI audit →
Typical impact: +2-5× organic installs
🔔Notify me when this app's revenue changes by

📊 Performance Tracking LIVE

2 snapshots on record
idle
0%
Rating
4.7
Reviews
46,656 reviews
Forecast Revenue / mo
$5.0K
Snapshots tracked
2
since May 2026
ONE-TIME · BUILD 💰 Estimated build cost
$125K
↳ What it cost to build · not monthly revenue
Likely range $95K – $170K
$25K · MVP floor $100K · indie scale $500K+ · studio build
📈 Pays back in ~2.1y at current MRR

Synthetic estimate. Inputs: category complexity, file size, screen count, monetization layer, platform reach, age × team-size proxy. Calibrated against 2024-2026 indie-agency rate surveys. Full math + source list on /methodology.

Where the money goes
🧱 MVP baseline (design + 1-store ship) +$28K
📱 5 unique screens × $4.5K +$22K
🌐 Cross-platform reach (iOS + Android) +$27K
⚙ 7.4y maintenance × ~1-person team +$44K
Total estimate $125K
ONE-TIME · EXIT VALUE 💵 Estimated acquisition value
$100K
↳ What it would sell for · not monthly revenue
Marketplace range $75K – $125K · 21× MRR multiple
💸 ~0.8× build cost (under-water)

Synthetic estimate. Multiple band derived from ad-supported + age, rating quality, category demand, and user-base maturity. Calibrated against 2024-2026 indie-app-marketplace closed-deal medians. Full math + comparable deal list on /methodology.

How the multiple was built
📺 Ad-supported base 15× MRR
📅 7.4y proven track record +20%
⭐ ★ rating ≥ 4.7 (premium) +15%
Final multiple 21× MRR
👥 Estimated audience size
4.8M
Lifetime downloads (US-equivalent)
Monthly active
490K
Daily active
98K

Synthetic estimate from ratings × category benchmarks. Calibrated against 2024-2026 mobile-attribution retention + DAU/MAU reports. Numbers are US-storefront-equivalent — true global audience can be 5-10× larger for international apps. Full math + source list on /methodology.

How we sized it
📲 Travel & Local engagement ~150 installs / rating
📅 7.4y of rating accumulation -30%
🔁 Travel & Local D30 retention 15%
📍 DAU / MAU stickiness 0.20
DAU / MAU 20% sticky
🛠 Estimated tech stack
🤖
Native Android (Kotlin)
High confidence · 80%
Also possible
Flutter

Heuristic guess from app bundle size, category, store description signals, and release-date stack era. Bumetric does not disassemble binaries — for binary-level certainty you would need an SDK intelligence tool or the manifest itself. Reasoning chain on the right. Full ruleset on /methodology.

Signals we read
🏷 Category context Travel & Local
📦 Compact Android bundle → Native Kotlin
💀 Maintenance status
Active
15%
Last shipped 2026-10-20 · 33 days ago
0 · Active 50 · At risk 100 · Abandoned

Heuristic risk score from time-since-last-update + ratings velocity proxy + Editor's Choice / curated featuring signals. Calibrated against 2024-2025 app-store ranking decay reports. Not a guarantee — a quiet app with a healthy codebase looks the same as an abandoned one until something breaks. Full math on /methodology.

Risk signals
📅 33 days since last update Healthy release cadence
Verdict Active
🔬

How we forecast this revenue

MEDIUM CONFIDENCE
Baseline
$5.0K/mo · ML-estimated from 234 triggers
Growth rate
+4.0% MoM · MID tier baseline (compound monthly)
6 months
$4.7K – $7.9K
12 months
$5.2K – $10.8K
24 months
$6.4K – $19.2K
Compound growth at +4.0% MoM (tier baseline for MID). Range widens with horizon — typical noise band ±25% at 6mo.. Ranges widen with horizon — distant futures carry more uncertainty.
📊

BU Investment Matrix

Below median · 45/100MID TIERunderperforming peers
RevenueQualityMarketGrowthMoatSafetyFounderMonetiz.
Revenue Strength
3.7
Product Quality
9.4
Market Position
0.0
Growth Velocity
5.0
Defensibility
3.9
Operational Safety
10.0
Founder Strength
3.4
Monetization Maturity
1.0
  • 💰 Revenue: Modest — $3K - $7K/mo · MID tier · medium confidence, trajectory unclear.
  • ⭐ Quality: 4.7★ across 46,656 reviews — exceptional (top 1% in category).
  • 📍 Market: Not yet charting in any of the 9 monitored markets.
  • 📈 Growth: Insufficient signal to assess trajectory.
  • ⚠️ Risk: Low — no material risk signals detected.
🎯 For competitors: Mixed picture. Worth competing if you have a clear UX or pricing edge — otherwise crowded segment.
💵 For acquirers: Estimated asking range 18-32× monthly = $90K-$160K.
Composite of 8 dimensions computed deterministically from public signals — no LLM, every score traces back to a measurable input. Default weights shown; "compete" / "acquire" / "invest" lenses re-weight without re-fetching.
Range:

💰 Forecast Revenue / mo

MODEL
Revenue forecast computed from BU's 234 trigger model on each snapshot. Calibrated against ground-truth from 58 verified-revenue apps.
🔬Forecast Breakdown — Why This Estimate?Top 7 of 7 triggers
Our ML model uses 200+ signals from public data. These are the most influential for this app:
Mid install base (46,656 ratings)METRIC
+$5,500
Excellent rating (4.7★)METRIC
+$2,200
securityREVIEW
+$1,800
cancelledREVIEW
−$1,500
excellent appREVIEW
+$1,500
Established app (7y old)METRIC
+$800
Ad-supported / freemiumMETRIC
+$600
METRIC = structural app data · REVIEW = mined from user reviews · ✓ VERIFIED = Stripe-verified anchor (TrustMRR)

📈 Reviews Growth

LIVE
Cumulative review count from first BU snapshot. Each point = a tracked update.

⭐ Rating Trend

LIVE
Average rating evolution. Updates with each new review batch.

Profile & Insights

Everything we know — and don't — about this app and its company.

Identification

App name
B&B HOTELS
Developer
B&B HOTELS
Bundle ID
com.bbhotel.android
App Store URL
Open in App Store
Category
Travel & Local
Content rating
Not found
Languages
Not found

Company

Website
www.hotel-bb.com
Tagline
Not found
Description
Not found
Founded
Not found
HQ / Address
Not found
Employees
Not found
Logo
Not found

Revenue

Reported revenue signal / mo
Not found
AI revenue estimate / mo
Not found
AI annual estimate
Not found
Model estimate / mo
$5.0K/mo
Top-grossing rank
Not found
All-time revenue
Not found
Pricing
Not found

Founder

Founder data not yet collected for this app.

Funding

Funding data not yet collected for this app.

Press & Links

Press & Links data not yet collected for this app.

Contacts & Socials

Contacts & Socials data not yet collected for this app.
🚀Update Frequency · Releases per Quarter2 releases tracked
11Q2 2026Q4 2026
🚀Version Release Timeline2 releases tracked
v4.34.1May 2026v4.40.0Nov 2026
Profile is built from iTunes Lookup + developer site scrape + ML revenue model. Empty fields show "Not found" — additional sources (Crunchbase, X, IndieHackers, Acquire.com) coming.

📝 About this app

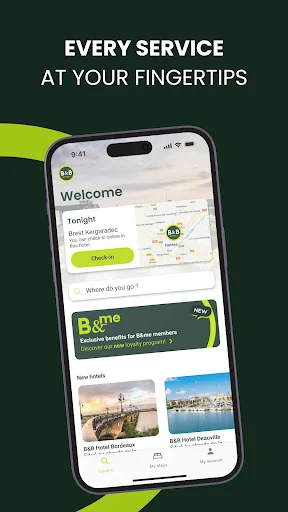
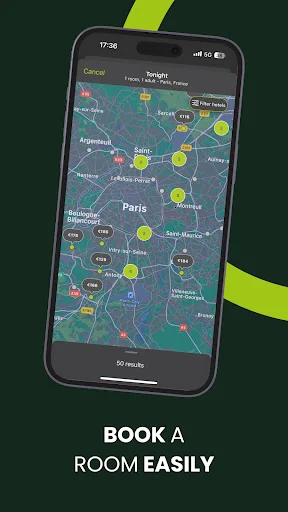
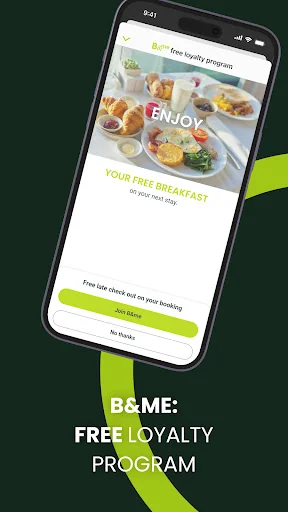
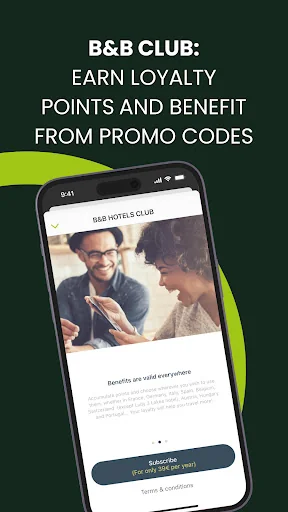
Planning a trip? Looking to travel at the fairest price without compromising on comfort and quality? Discover the new B&B HOTELS app for a unique experience, whether it's a business trip, a weekend getaway, a vacation, or a last-minute stay.

B&B HOTELS offers more than 700 hotels in Europe and Brazil. Our hotels provide a generous breakfast buffet, the comfort of a good bed, the security of reliable Wi-Fi, parking, and much more!

With the B&B HOTELS mobile app:
• Save time and enjoy your room immediately with online check-in.… View full description on the official store →
App Specs
🔐 Own this app? Claim & verify MRR →
🔖 v4.40.0🔄 updated 1mo ago📂 Travel & Local💰 Free🚀 Launched 2019 (7y old)
📅

What Worked™ · Development Pipeline

2 EVENTS TRACKED
Detected changes in this app over its tracked lifetime — each event links cause (what changed) to effect (what moved). Sorted newest first.See full history →Version history →
2026-10
🔧
Shipped update — v4.34.1 → v4.40.0
→ 30 days after: reviews +8,144 medium · co-occurring
2026-05
🚀
First tracked snapshot — initial data captured
🧪

Tech & Domain Intel — hotel-bb.com

Mail provider
Google Workspace
Tech stack
Google Workspace · Meta (Facebook) Ads · SendGrid
Derived from public RDAP + DNS TXT records (no scraping, no login).
🔔

Track this app’s revenue

FREE
Get an email when revenue moves by your threshold. No spam, unsubscribe in one click.

📝 Description

95
BU Score · Transcendent
Full revenue analysis
Read the article-style breakdown for B&B HOTELS: category rank, percentile, growth signal, comparable apps, and how the forecast is calibrated against verified-MRR anchors in this niche.
Read deep-dive →

Similar apps in Travel & Local

About this analysis
ZCAnalyzed by Zakhar Chumak · founder, Bumetric·Full methodology·High confidence

Why high confidence: 46,656 ratings · no founder-verified revenue (model estimate only).

❓ Frequently Asked Questions

10 answers · auto-generated from this app's public data
How much does B&B HOTELS make per month?▴
Based on our ML-calibrated revenue forecast, B&B HOTELS earns approximately $5.0K/mo. This is a US-storefront-equivalent estimate; global revenue can be several times larger for internationally-distributed apps. See the methodology page for the full formula and confidence bands.
Is B&B HOTELS profitable?▴
With estimated build cost $125K and monthly revenue $5.0K, B&B HOTELS looks break-even-grade — payback period sits around 2.1 years. Profitability also depends on paid-acquisition spend and refund rate which the public model doesn't see.
How many users does B&B HOTELS have?▴
Estimated audience: ~4.8M lifetime downloads, ~490K monthly active users, and ~98K daily active users. Derived from ratings count × category installs-per-rating × age decay. US-storefront-equivalent — global audience can be 5-10× larger for internationally-distributed apps.
What apps are like B&B HOTELS?▴
Browse the full Travel & Local category catalog to find similar apps with revenue, build cost, audience and tech stack data. Each /p/{slug} page also shows a Compare side-by-side widget with three peer apps from the same niche.
What is B&B HOTELS built with?▴
Our heuristic places B&B HOTELS on the Native Android (Kotlin) stack (High confidence, 80%). Signals: app bundle size, category context, store-description markers, release-date era. We don't disassemble binaries. Alternative possibilities: Flutter.
Is B&B HOTELS still actively maintained?▴
Maintenance status: Active (15% abandonment risk). Last shipped version was 1 months ago. The risk score combines time-since-last-update with Editor's Choice / curated featuring + user-base maturity adjustments.
How much would B&B HOTELS sell for?▴
Estimated acquisition value: $100K (marketplace range $75K – $125K). Calculated as 21× monthly revenue using the standard multiple for the detected monetization model + adjustments for age, rating quality and category demand. Calibrated against 2024-2026 Flippa / Acquire.com / MicroAcquire closed-deal medians.
When was B&B HOTELS last updated?▴
B&B HOTELS last shipped a new version on 2026-10-20 — 1 months ago. This is the date Apple / Google last accepted a new build, not a content-only push.
Who makes B&B HOTELS?▴
B&B HOTELS is published by B&B HOTELS on the Google Play Store. See the full publisher portfolio (other apps by the same developer) via the More by developer block on the product page above.
What is B&B HOTELS's BU Score?▴
B&B HOTELS has a BU Score of 70/100 (Strong). The score combines App Store rating, ratings count, monetization model and revenue signals calibrated against founder-verified MRR anchors. See the BU Score formula.