1.2M Android Apps Tracked Updated 4 min ago Revenue Forecasts
Add an app Create Account Sign In
Home

Booking.com: Hotels & Travel

87
Quality Score
Excellent

Booking.com: Hotels & Travel

High confidence
4.8 ✍️ Editor
✍️ bumetric analysis

Booking.com targets the broad travel accommodation market, directly competing with major players like Expedia, Airbnb, and Hotels.com. Its high user rating, backed by nearly three million reviews, signals robust traction and a mature product in the growth stage, indicating strong user satisfaction and a significant, active user base. While the app itself is free, its revenue model is commission-based on bookings, typical for this category. A key monetization observation for travel apps like this is the reliance on high volume and repeat bookings; user retention through loyalty programs or personalized offers is often more impactful than trying to upsell premium app features, as the core value is in facilitating the booking itself. The focus remains on optimizing conversion rates within the booking funnel rather than in-app purchases.

BU Score 87 · Excellent — strong product-market fit. The full Investment Matrix below scores 8 dimensions including monetisation, growth, and operational risk.

Track snapshot history and revenue forecast in the Performance section below.

💰 Monthly revenue · now vs forecast
● Right now
$6.8K
per month
12-mo forecast
$7.1K – $14.8K
per month
24-mo forecast
$8.8K – $26.3K
per month
MID tier
💡 Grow this revenue
Free AI audit of this app’s store listing
  • Title & subtitle keyword fit
  • Description hook & conversion structure
  • Screenshots, ratings, reviews strategy
Run free AI audit →
Typical impact: +2-5× organic installs
🔔Notify me when this app's revenue changes by

📊 Performance Tracking LIVE

Loading…
idle
0%
Rating
Reviews
Forecast Revenue / mo
Snapshots tracked
0
since first record
ONE-TIME · BUILD 💰 Estimated build cost
$80K
What it cost to build · not monthly revenue
Likely range $60K – $110K
$25K · MVP floor $100K · indie scale $500K+ · studio build
📈 Pays back in ~12 months at current MRR

Synthetic estimate. Inputs: category complexity, file size, screen count, monetization layer, platform reach, age × team-size proxy. Calibrated against 2024-2026 indie-agency rate surveys. Full math + source list on /methodology.

Where the money goes
🧱 MVP baseline (design + 1-store ship) +$28K
📱 5 unique screens × $4.5K +$22K
🌐 Cross-platform reach (iOS + Android) +$27K
Total estimate $80K
ONE-TIME · EXIT VALUE 💵 Estimated acquisition value
$125K
What it would sell for · not monthly revenue
Marketplace range $100K – $175K · 19× MRR multiple
💸 ~1.6× build cost (break-even+)

Synthetic estimate. Multiple band derived from ad-supported + age, rating quality, category demand, and user-base maturity. Calibrated against 2024-2026 indie-app-marketplace closed-deal medians. Full math + comparable deal list on /methodology.

How the multiple was built
📺 Ad-supported base 15× MRR
★ rating ≥ 4.7 (premium) +15%
Mature user base (1M+ ratings) +8%
Final multiple 19× MRR
👥 Estimated audience size
901.0M
Lifetime downloads (US-equivalent)
Monthly active
135.0M
Daily active
27.0M

Synthetic estimate from ratings × category benchmarks. Calibrated against 2024-2026 mobile-attribution retention + DAU/MAU reports. Numbers are US-storefront-equivalent — true global audience can be 5-10× larger for international apps. Full math + source list on /methodology.

How we sized it
📲 Travel & Local engagement ~150 installs / rating
🔁 Travel & Local D30 retention 15%
📍 DAU / MAU stickiness 0.20
DAU / MAU 20% sticky
🔬

How we forecast this revenue

MEDIUM CONFIDENCE
Baseline
$6.8K/mo · ML-estimated from 234 triggers
Growth rate
+4.0% MoM · MID tier baseline (compound monthly)
6 months
$6.5K – $10.8K
12 months
$7.1K – $14.8K
24 months
$8.8K – $26.3K
Compound growth at +4.0% MoM (tier baseline for MID). Range widens with horizon — typical noise band ±25% at 6mo.. Ranges widen with horizon — distant futures carry more uncertainty.
📊

BU Investment Matrix

Below median · 50/100MID TIERunderperforming peers
RevenueQualityMarketGrowthMoatSafetyFounderMonetiz.
Revenue Strength
3.8
Product Quality
9.6
Market Position
0.0
Growth Velocity
5.0
Defensibility
6.0
Operational Safety
10.0
Founder Strength
5.0
Monetization Maturity
1.0
  • 💰 Revenue: Modest — $4K - $10K/mo · MID tier · medium confidence, trajectory unclear.
  • ⭐ Quality: 4.8★ across 6,007,448 reviews — exceptional (top 1% in category).
  • 📍 Market: Not yet charting in any of the 9 monitored markets.
  • 📈 Growth: Insufficient signal to assess trajectory.
  • ⚠️ Risk: Low — no material risk signals detected.
🎯 For competitors: Mixed picture. Worth competing if you have a clear UX or pricing edge — otherwise crowded segment.
💵 For acquirers: Estimated asking range 18-32× monthly = $122K-$218K.
Composite of 8 dimensions computed deterministically from public signals — no LLM, every score traces back to a measurable input. Default weights shown; "compete" / "acquire" / "invest" lenses re-weight without re-fetching.
Range:

💰 Forecast Revenue / mo

MODEL
Revenue forecast computed from BU's 234 trigger model on each snapshot. Calibrated against ground-truth from 58 verified-revenue apps.
🔬Forecast Breakdown — Why This Estimate?Top 4 of 4 triggers
Our ML model uses 200+ signals from public data. These are the most influential for this app:
High install base (6,007,448 ratings)METRIC
+$12,000
Excellent rating (4.8★)METRIC
+$2,200
Mature app (15y old)METRIC
+$1,500
Ad-supported / freemiumMETRIC
+$600
METRIC = structural app data · REVIEW = mined from user reviews · ✓ VERIFIED = Stripe-verified anchor (TrustMRR)

📈 Reviews Growth

LIVE
Cumulative review count from first BU snapshot. Each point = a tracked update.

⭐ Rating Trend

LIVE
Average rating evolution. Updates with each new review batch.

Profile & Insights

Everything we know — and don't — about this app and its company.

Identification

App name
Booking.com: Hotels & Travel
Developer
Booking.com Hotels & Vacation Rentals
Bundle ID
com.booking
App Store URL
Open in App Store
Category
Travel & Local
Content rating
Not found
Languages
Not found

Company

Website
www.booking.com
Tagline
Not found
Description
Not found
Founded
Not found
HQ / Address
Not found
Employees
Not found
Logo
Not found

Revenue

Verified revenue / mo
Not found
AI revenue estimate / mo
Not found
AI annual estimate
Not found
ML model estimate / mo
$6.8K/mo
Top-grossing rank
Not found
All-time revenue
Not found
Pricing
Not found

Founder

Founder data not yet collected for this app.

Funding

Funding data not yet collected for this app.

Press & Links

Press & Links data not yet collected for this app.

Contacts & Socials

Contacts & Socials data not yet collected for this app.
📈Ratings growth6,007,448 ratings+7% lifetimeShow 3-year history estimate ▾Jul 2023Jan 2025Jun 2026
Tracked (1 weeks) Pre-tracking estimate (36 weeks) · model-based, ±5% noise · anchored to release date and current value
Profile is built from iTunes Lookup + developer site scrape + ML revenue model. Empty fields show "Not found" — additional sources (Crunchbase, X, IndieHackers, Acquire.com) coming.

📝 About this app

Save on your next trip with the Booking.com app! Find great hotel or apartment deals and book in just a few minutes. You can also book flights, rental cars, and more through the app.

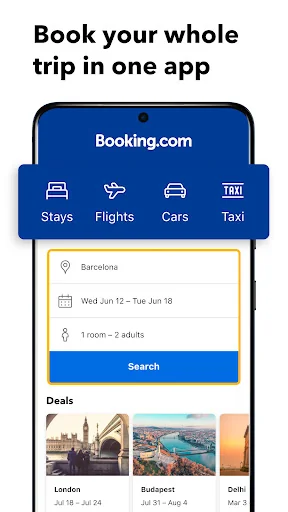
- Book your whole trip in one app (accommodations, flights, car rentals, taxis and more)
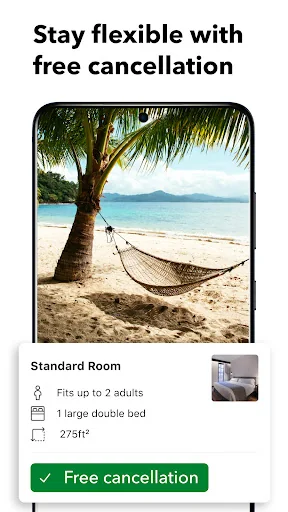
- Stay flexible with free cancellation (available at most properties)
- 24/7 customer service in more than 40 languages
- No booking or credit card fees
- Chat directly with your property in the app
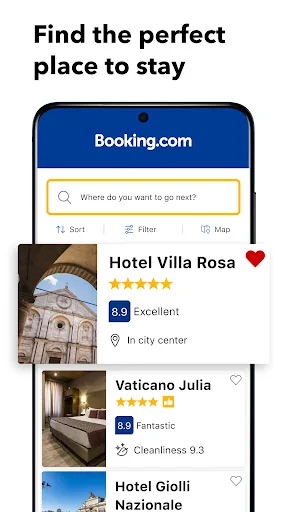
- Enjoy mobile-only discounts… View full description on the official store →
App Specs
🔐 Own this app? Claim & verify MRR →
🔖 vVaries with device🔄 updated 0d ago📂 Travel & Local💰 Free
🔔

Track this app’s revenue

FREE
Get an email when revenue moves by your threshold. No spam, unsubscribe in one click.

📝 Description

95
BU Score · Transcendent
Full revenue analysis
Read the article-style breakdown for Booking.com: Hotels & Travel: category rank, percentile, growth signal, comparable apps, and how the forecast is calibrated against verified-MRR anchors in this niche.
Read deep-dive →

More by Booking.com Hotels & Vacation Rentals

View all →
📦 Portfolio summaryINDIE studio
2apps·$9K/mocombined
Lead-app heavy — top app contributes 74%

Similar apps in Travel & Local

About this analysis
ZCAnalyzed by Zakhar Chumak · founder, bumetric·Full methodology·High confidence

Why high confidence: 6,007,448 ratings · no founder-verified revenue (model estimate only).

Frequently Asked Questions

4 answers · auto-generated from this app's public data
How much does Booking.com make per month?
Based on our ML-calibrated revenue forecast, Booking.com earns approximately $6.8K/mo. This is a US-storefront-equivalent estimate; global revenue can be several times larger for internationally-distributed apps. See the methodology page for the full formula and confidence bands.
What apps are like Booking.com?
Browse the full Travel & Local category catalog to find similar apps with revenue, build cost, audience and tech stack data. Each /p/{slug} page also shows a Compare side-by-side widget with three peer apps from the same niche.
Who makes Booking.com?
Booking.com is published by Booking.com Hotels & Vacation Rentals on the Google Play Store. See the full publisher portfolio (other apps by the same developer) via the More by developer block on the product page above.
What is Booking.com's BU Score?
Booking.com has a BU Score of 87/100 (Excellent). The score combines App Store rating, ratings count, monetization model and revenue signals calibrated against founder-verified MRR anchors. See the BU Score formula.