
PCMark for Android Benchmark

 51
51


PCMark for Android Benchmark is an Android app from UL Benchmarks in the Tools category, currently rated 3.3★ across 3,290 ratings. Initial signal reads as mixed reviews: supporters praise core features while critics cite stability and value gaps.
Quality Score is 51: Solid (established niche player). For a Tools app, that means established niche player. The full BU Investment Matrix below scores 8 dimensions including monetisation, growth, and operational risk.
Track changes month-over-month in the Performance section below: live snapshot history and revenue forecast included.
- Title & subtitle keyword fit
- Description hook & conversion structure
- Screenshots, ratings, reviews strategy
📊 Performance Tracking LIVE
Synthetic estimate. Inputs: category complexity, file size, screen count, monetization layer, platform reach, age × team-size proxy. Calibrated against 2024-2026 indie-agency rate surveys. Full math + source list on /methodology.
| 🧱 MVP baseline (design + 1-store ship) | +$28K |
| 📱 5 unique screens × $4.5K | +$22K |
| ⚙ Tools complexity ×0.90 | $-5049 |
| 🌐 Cross-platform reach (iOS + Android) | +$24K |
| ⚙ 11.9y maintenance × ~1-person team | +$71K |
Synthetic estimate. Multiple band derived from ad-supported + age, rating quality, category demand, and user-base maturity. Calibrated against 2024-2026 indie-app-marketplace closed-deal medians. Full math + comparable deal list on /methodology.
| 📺 Ad-supported base | 15× MRR |
| 📅 11.9y proven track record | +20% |
| ⭐ ★ rating < 3.5 (weak) | -18% |
| 🏷 Tools category multiple | -8% |
Synthetic estimate from ratings × category benchmarks. Calibrated against 2024-2026 mobile-attribution retention + DAU/MAU reports. Numbers are US-storefront-equivalent — true global audience can be 5-10× larger for international apps. Full math + source list on /methodology.
| 📲 Tools engagement | ~190 installs / rating |
| 📅 11.9y of rating accumulation | -30% |
| 🔁 Tools D30 retention | 22% |
| 📍 DAU / MAU stickiness | 0.18 |
Heuristic guess from app bundle size, category, store description signals, and release-date stack era. Bumetric does not disassemble binaries — for binary-level certainty you would need an SDK intelligence tool or the manifest itself. Reasoning chain on the right. Full ruleset on /methodology.
| 🏷 Category context | Tools |
| 📦 Compact Android bundle | → Native Kotlin |
Heuristic risk score from time-since-last-update + ratings velocity proxy + Editor's Choice / curated featuring signals. Calibrated against 2024-2025 app-store ranking decay reports. Not a guarantee — a quiet app with a healthy codebase looks the same as an abandoned one until something breaks. Full math on /methodology.
| 📅 5y+ since last update | Likely abandoned |
| • 12y old + 1y+ no update | +5% (API deprecation drift) |
How we forecast this revenue
LOW CONFIDENCEBU Investment Matrix
Pre-traction · 36/100INDIE TIERlimited signal- 💰 Revenue: Marginal — $200 - $1250/mo · INDIE tier · medium confidence, trajectory unclear.
- ⭐ Quality: 3.32★ across 3,290 reviews — below category median.
- 📍 Market: Not yet charting in any of the 9 monitored markets.
- 📈 Growth: ⚠ last update 1920d ago — possibly dormant.
- ⚠️ Risk: Elevated — dormant (1920d since update).
💰 Forecast Revenue / mo
MODEL| 5 starREVIEW | +$1,800 | |
| Low install base (3,290 ratings)METRIC | +$1,500 | |
| Below-average rating (3.3★)METRIC | −$1,500 | |
| Mature app (11y old)METRIC | +$1,500 | |
| slowREVIEW | −$1,200 | |
| Ad-supported / freemiumMETRIC | +$600 |
📈 Reviews Growth
LIVE⭐ Rating Trend
LIVEProfile & Insights
Identification
- App name
- PCMark for Android Benchmark
- Developer
- UL Benchmarks
- Bundle ID
- com.futuremark.pcmark.android.benchmark
- App Store URL
- Open in App Store
- Category
- Tools
- Content rating
- Not found
- Languages
- Not found
Company
- Website
- benchmarks.ul.com
- Tagline
- Not found
- Description
- Not found
- Founded
- Not found
- HQ / Address
- Not found
- Employees
- Not found
- Logo
- Not found
Revenue
- Reported revenue signal / mo
- Not found
- AI revenue estimate / mo
- Not found
- AI annual estimate
- Not found
- Model estimate / mo
- $500/mo
- Top-grossing rank
- Not found
- All-time revenue
- Not found
- Pricing
- Not found
Founder
Funding
Press & Links
Contacts & Socials
📝 About this app
<b>Work 3.0 benchmark</b>
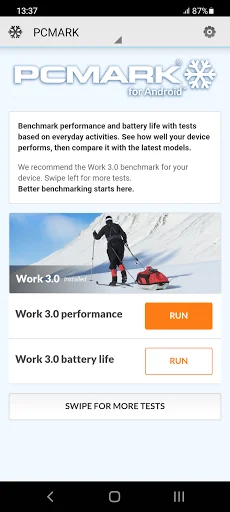
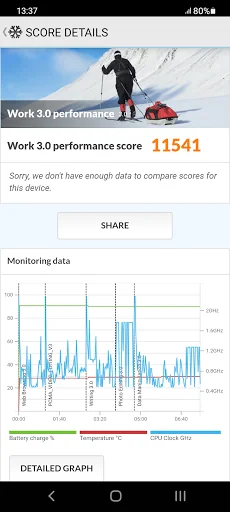
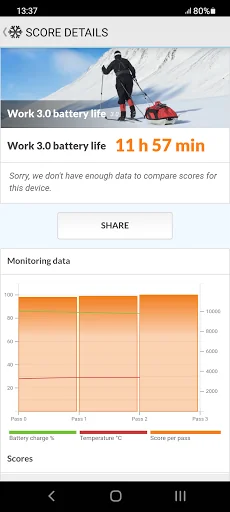
See how your device handles common productivity tasks— browsing the web, editing videos, working with documents and data, and editing photos. Use Work 3.0 to measure the performance and battery life of your device with tests based on real applications.
<b>Storage 2.0 benchmark</b>
Slow storage speed in a device can cause annoying lag and stutters in everyday use.… View full description on the official store →
Track this app’s revenue
FREE📝 Description
95
More by UL Benchmarks
View all →






Why medium confidence: 3,290 ratings · no founder-verified revenue (model estimate only).