
Graph Maker (line/bar/pie)
 31
31


Graph Maker (line/bar/pie) is an Android app from garakutatoys in the Productivity category, currently rated 2.2★ across 72 ratings. Initial signal reads as mostly critical sentiment so far: users flag rough edges and unmet expectations.
Quality Score is 31: Emerging (early traction worth watching). For a Productivity app, that means early traction worth watching. The full BU Investment Matrix below scores 8 dimensions including monetisation, growth, and operational risk.
Track changes month-over-month in the Performance section below: live snapshot history and revenue forecast included.
- Title & subtitle keyword fit
- Description hook & conversion structure
- Screenshots, ratings, reviews strategy
📊 Performance Tracking LIVE
Synthetic estimate. Inputs: category complexity, file size, screen count, monetization layer, platform reach, age × team-size proxy. Calibrated against 2024-2026 indie-agency rate surveys. Full math + source list on /methodology.
| 🧱 MVP baseline (design + 1-store ship) | +$28K |
| 📱 5 unique screens × $4.5K | +$22K |
| ⚙ Productivity complexity ×1.10 | +$5K |
| 🌐 Cross-platform reach (iOS + Android) | +$30K |
How we forecast this revenue
LOW CONFIDENCEBU Investment Matrix
Pre-traction · 34/100INDIE TIERlimited signal- 💰 Revenue: Marginal — $200 - $1250/mo · INDIE tier · medium confidence, trajectory unclear.
- ⭐ Quality: 2.17★ across 72 reviews — weak — significant quality concerns.
- 📍 Market: Not yet charting in any of the 9 monitored markets.
- 📈 Growth: ⚠ last update 1063d ago — possibly dormant.
- ⚠️ Risk: Elevated — dormant (1063d since update).
💰 Forecast Revenue / mo
MODEL| Below-average rating (2.2★)METRIC | −$1,500 | |
| Established app (6y old)METRIC | +$800 | |
| Ad-supported / freemiumMETRIC | +$600 | |
| Pre-traction phase (72 ratings)METRIC | −$300 |
📈 Reviews Growth
LIVE⭐ Rating Trend
LIVEProfile & Insights
Identification
- App name
- Graph Maker (line/bar/pie)
- Developer
- garakutatoys
- Bundle ID
- com.milktea.garakuta.graphmaker
- App Store URL
- Open in App Store
- Category
- Productivity
- Content rating
- Not found
- Languages
- Not found
Company
- Website
- garakutatoys.blogspot.com
- Tagline
- Not found
- Description
- Not found
- Founded
- Not found
- HQ / Address
- Not found
- Employees
- Not found
- Logo
- Not found
Revenue
- Verified revenue / mo
- Not found
- AI revenue estimate / mo
- Not found
- AI annual estimate
- Not found
- ML model estimate / mo
- $29/mo
- Top-grossing rank
- Not found
- All-time revenue
- Not found
- Pricing
- Not found
Founder
Funding
Press & Links
Contacts & Socials
📈Ratings growth72 ratings+41% lifetimeShow 3-year history estimate ▾
📝 About this app
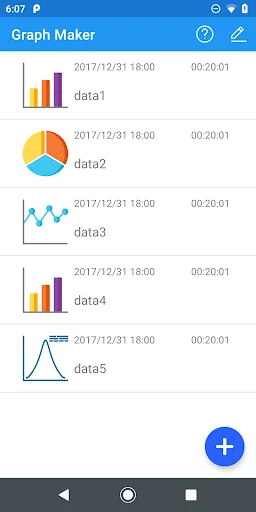
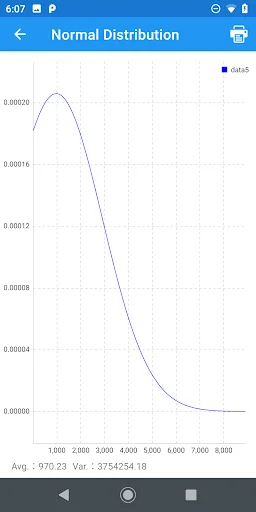
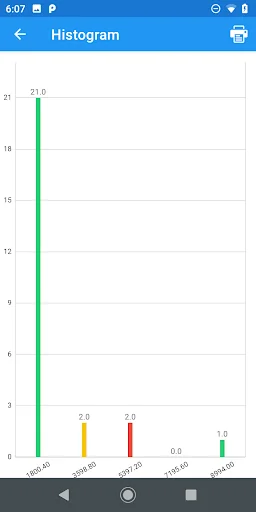
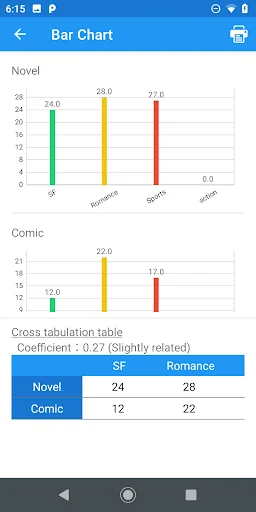
You can automatically create a graph from binary data (category and number, number and number, category and category).
〇 Type of data that can be input
1. Category and quantity
Used to analyze "category and quantity" such as the type and quantity of items sold.
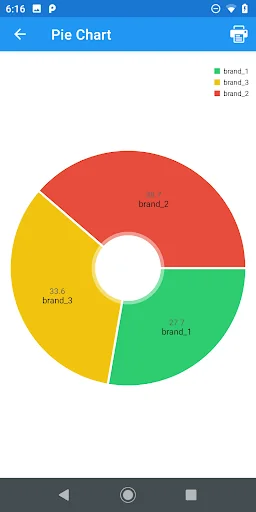
You can create pie charts and scatter charts.
The pie chart shows the percentage of input data.
The scatter plot shows the distribution and correlation of the data.
2. Quantity and quantity… View full description on the official store →
Track this app’s revenue
FREE📝 Description
95
More by garakutatoys
View all →




Similar apps in Productivity


Why low confidence: only 72 ratings · no founder-verified revenue (model estimate only) · revenue figure is directional only.