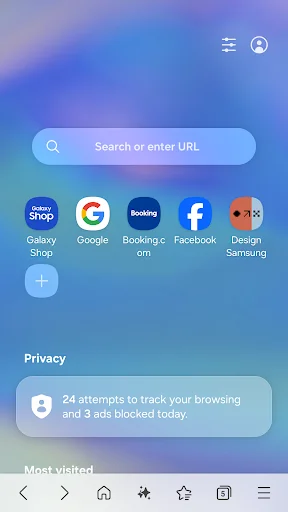
1.2M Android Apps Tracked Updated 4 min ago Revenue Forecasts
Add an app Create Account Sign In
Home

Samsung Browser

75
Quality Score
Strong

Samsung Browser

High confidence
3.6 ✍️ Editor
✍️ bumetric analysis

This Communication category app carves out a niche as Samsung's proprietary Android browser, directly competing with established players like Google Chrome and Mozilla Firefox. With millions of ratings, it signals massive user traction, indicative of a mature, widely adopted product, rather than an early-stage growth app. The volume of ratings, despite an average score, demonstrates significant market penetration, likely driven by its default status on Samsung devices. As a free app, direct revenue generation isn't the primary goal here. In the browser category, monetization typically involves data licensing, search engine partnerships, or integrated affiliate programs rather than direct IAPs or ads, leveraging the extensive user base for indirect revenue streams. Future growth could focus on enhancing premium features or deeper integration with Samsung's ecosystem for value-added services.

BU Score 75 · Strong — healthy traction. The full Investment Matrix below scores 8 dimensions including monetisation, growth, and operational risk.

Track snapshot history and revenue forecast in the Performance section below.

💰 Monthly revenue · now vs forecast
● Right now
$700K
per month
12-mo forecast
$741K – $1141K
per month
24-mo forecast
$886K – $1645K
per month
BIG tier
💡 Grow this revenue
Free AI audit of this app’s store listing
  • Title & subtitle keyword fit
  • Description hook & conversion structure
  • Screenshots, ratings, reviews strategy
Run free AI audit →
Typical impact: +2-5× organic installs
🔔Notify me when this app's revenue changes by

📊 Performance Tracking LIVE

Loading…
idle
0%
Rating
Reviews
Forecast Revenue / mo
Snapshots tracked
0
since first record
ONE-TIME · BUILD 💰 Estimated build cost
$130K
What it cost to build · not monthly revenue
Likely range $100K – $175K
$25K · MVP floor $100K · indie scale $500K+ · studio build
📈 Pays back in ~1.4y at current MRR

Synthetic estimate. Inputs: category complexity, file size, screen count, monetization layer, platform reach, age × team-size proxy. Calibrated against 2024-2026 indie-agency rate surveys. Full math + source list on /methodology.

Where the money goes
🧱 MVP baseline (design + 1-store ship) +$28K
📱 5 unique screens × $4.5K +$22K
Communication complexity ×1.65 +$32K
🌐 Cross-platform reach (iOS + Android) +$45K
Total estimate $130K
ONE-TIME · EXIT VALUE 💵 Estimated acquisition value
$125K
What it would sell for · not monthly revenue
Marketplace range $75K – $150K · 16× MRR multiple
💸 ~1.0× build cost (under-water)

Synthetic estimate. Multiple band derived from ad-supported + age, rating quality, category demand, and user-base maturity. Calibrated against 2024-2026 indie-app-marketplace closed-deal medians. Full math + comparable deal list on /methodology.

How the multiple was built
📺 Ad-supported base 15× MRR
★ rating 3.5-4.0 (mixed) -8%
🏷 Communication category multiple +5%
Mature user base (1M+ ratings) +8%
Final multiple 16× MRR
👥 Estimated audience size
559.5M
Lifetime downloads (US-equivalent)
Monthly active
167.5M
Daily active
100.5M

Synthetic estimate from ratings × category benchmarks. Calibrated against 2024-2026 mobile-attribution retention + DAU/MAU reports. Numbers are US-storefront-equivalent — true global audience can be 5-10× larger for international apps. Full math + source list on /methodology.

How we sized it
📲 Communication engagement ~95 installs / rating
🔁 Communication D30 retention 30%
📍 DAU / MAU stickiness 0.60
DAU / MAU 60% sticky
🔬

How we forecast this revenue

MEDIUM CONFIDENCE
Baseline
$700K/mo · ML-estimated from 234 triggers
Growth rate
+2.5% MoM · BIG tier baseline (compound monthly)
6 months
$690K – $933K
12 months
$741K – $1.1M
24 months
$886K – $1.6M
Compound growth at +2.5% MoM (tier baseline for BIG). Range widens with horizon — typical noise band ±15% at 6mo.. Ranges widen with horizon — distant futures carry more uncertainty.
📊

BU Investment Matrix

Mixed signals · 55/100BIG TIERcompetitive but cautious
GrowthFounderQualityRevenueMonetiz.MoatMarketSafety
Growth Velocity
5.0
Founder Strength
7.6
Product Quality
7.2
Revenue Strength
5.8
Monetization Maturity
1.0
Defensibility
7.5
Market Position
0.0
Operational Safety
10.0
  • 💰 Revenue: Healthy — $280K - $1540K/mo · BIG tier · medium-low confidence, trajectory unclear.
  • ⭐ Quality: 3.59★ across 5,892,231 reviews — solid.
  • 📍 Market: Not yet charting in any of the 9 monitored markets.
  • 📈 Growth: Insufficient signal to assess trajectory.
  • ⚠️ Risk: Low — no material risk signals detected.
🎯 For competitors: Mixed picture. Worth competing if you have a clear UX or pricing edge — otherwise crowded segment.
💵 For acquirers: Estimated asking range 18-32× monthly = $12.6M-$22.4M.
Composite of 8 dimensions computed deterministically from public signals — no LLM, every score traces back to a measurable input. Default weights shown; "compete" / "acquire" / "invest" lenses re-weight without re-fetching.
Range:

💰 Forecast Revenue / mo

MODEL
Revenue forecast computed from BU's 234 trigger model on each snapshot. Calibrated against ground-truth from 58 verified-revenue apps.
🔬Forecast Breakdown — Why This Estimate?Top 3 of 3 triggers
Our ML model uses 200+ signals from public data. These are the most influential for this app:
High install base (5,892,231 ratings)METRIC
+$12,000
Mature app (10y old)METRIC
+$1,500
Ad-supported / freemiumMETRIC
+$600
METRIC = structural app data · REVIEW = mined from user reviews · ✓ VERIFIED = Stripe-verified anchor (TrustMRR)

📈 Reviews Growth

LIVE
Cumulative review count from first BU snapshot. Each point = a tracked update.

⭐ Rating Trend

LIVE
Average rating evolution. Updates with each new review batch.

Profile & Insights

Everything we know — and don't — about this app and its company.

Identification

App name
Samsung Browser
Developer
Samsung Electronics Co., Ltd.
Bundle ID
com.sec.android.app.sbrowser
App Store URL
Open in App Store
Category
Communication
Content rating
Not found
Languages
Not found

Company

Website
help.content.samsung.com
Tagline
Not found
Description
Not found
Founded
Not found
HQ / Address
Not found
Employees
Not found
Logo
Not found

Revenue

Verified revenue / mo
Not found
AI revenue estimate / mo
Not found
AI annual estimate
Not found
ML model estimate / mo
$7.4K/mo
Top-grossing rank
Not found
All-time revenue
Not found
Pricing
Not found

Founder

Founder data not yet collected for this app.

Funding

Funding data not yet collected for this app.

Press & Links

Press & Links data not yet collected for this app.

Contacts & Socials

Contacts & Socials data not yet collected for this app.
📈Ratings growth5,892,231 ratings+41% lifetimeShow 3-year history estimate ▾Jul 2023Feb 2025Jul 2026
Tracked (2 weeks) Pre-tracking estimate (37 weeks) · model-based, ±5% noise · anchored to release date and current value
Profile is built from iTunes Lookup + developer site scrape + ML revenue model. Empty fields show "Not found" — additional sources (Crunchbase, X, IndieHackers, Acquire.com) coming.

📝 About this app

Samsung Browser provides the best web browsing experience for you with Video Assistant, Dark Mode, Customize menu, Extensions such as Translator, and by protecting your privacy with Secret mode, Smart Anti-Tracking and Smart Protection.

Samsung Browser with tiles and complication feature is available on Galaxy Watch devices that support Wear OS (※ Galaxy Watch 4 series and models released later)

■ New Features for you
* Supports text search within images
You can search for text included in images in the Find on page menu.

■ Security & Privacy… View full description on the official store →
App Specs
🔐 Own this app? Claim & verify MRR →
🔖 vVaries with device🔄 updated 0d ago📂 Communication💰 Free
📅

What Worked™ · Development Pipeline

2 EVENTS TRACKED
Detected changes in this app over its tracked lifetime — each event links cause (what changed) to effect (what moved). Sorted newest first.See full history →Version history →
2026-05
🔧
Shipped update — vVaries with device → vVaries with device
→ 30 days after: reviews +6,187 high confidence
2026-05
🚀
First tracked snapshot — initial data captured
→ 30 days after: reviews +6,187 high confidence
🔔

Track this app’s revenue

FREE
Get an email when revenue moves by your threshold. No spam, unsubscribe in one click.

📝 Description

95
BU Score · Transcendent
Full revenue analysis
Read the article-style breakdown for Samsung Browser: category rank, percentile, growth signal, comparable apps, and how the forecast is calibrated against verified-MRR anchors in this niche.
Read deep-dive →

More by Samsung Electronics Co., Ltd.

View all →
📦 Portfolio summaryMID studio
78apps·$138K/mocombined
✓ Diversified — top app contributes 7%; risk spread across portfolio

Similar apps in Communication

About this analysis
ZCAnalyzed by Zakhar Chumak · founder, bumetric·Full methodology·High confidence

Why high confidence: 5,892,231 ratings · no founder-verified revenue (model estimate only).

Frequently Asked Questions

4 answers · auto-generated from this app's public data
How much does Samsung Browser make per month?
Based on our ML-calibrated revenue forecast, Samsung Browser earns approximately $7.4K/mo. This is a US-storefront-equivalent estimate; global revenue can be several times larger for internationally-distributed apps. See the methodology page for the full formula and confidence bands.
What apps are like Samsung Browser?
Browse the full Communication category catalog to find similar apps with revenue, build cost, audience and tech stack data. Each /p/{slug} page also shows a Compare side-by-side widget with three peer apps from the same niche.
Who makes Samsung Browser?
Samsung Browser is published by Samsung Electronics Co., Ltd. on the Google Play Store. See the full publisher portfolio (other apps by the same developer) via the More by developer block on the product page above.
What is Samsung Browser's BU Score?
Samsung Browser has a BU Score of 75/100 (Strong). The score combines App Store rating, ratings count, monetization model and revenue signals calibrated against founder-verified MRR anchors. See the BU Score formula.