My Verizon
 81
81


My Verizon is an Android app from Verizon Consumer Group in the Tools category, currently rated 4.6★ across 1,294,136 ratings. Initial signal reads as largely positive sentiment, users highlighting consistency and feature depth.
Quality Score is 81: Excellent (strong product-market fit). For a Tools app, that means strong product-market fit. The full BU Investment Matrix below scores 8 dimensions including monetisation, growth, and operational risk.
Track changes month-over-month in the Performance section below: live snapshot history and revenue forecast included.
- Title & subtitle keyword fit
- Description hook & conversion structure
- Screenshots, ratings, reviews strategy
📊 Performance Tracking LIVE
Synthetic estimate. Inputs: category complexity, file size, screen count, monetization layer, platform reach, age × team-size proxy. Calibrated against 2024-2026 indie-agency rate surveys. Full math + source list on /methodology.
| 🧱 MVP baseline (design + 1-store ship) | +$28K |
| 📱 5 unique screens × $4.5K | +$22K |
| ⚙ Tools complexity ×0.90 | $-5049 |
| 🌐 Cross-platform reach (iOS + Android) | +$24K |
Synthetic estimate. Multiple band derived from ad-supported + age, rating quality, category demand, and user-base maturity. Calibrated against 2024-2026 indie-app-marketplace closed-deal medians. Full math + comparable deal list on /methodology.
| 📺 Ad-supported base | 15× MRR |
| ⭐ ★ rating ≥ 4.4 (solid) | +8% |
| 🏷 Tools category multiple | -8% |
| ⭐ Mature user base (1M+ ratings) | +8% |
Synthetic estimate from ratings × category benchmarks. Calibrated against 2024-2026 mobile-attribution retention + DAU/MAU reports. Numbers are US-storefront-equivalent — true global audience can be 5-10× larger for international apps. Full math + source list on /methodology.
| 📲 Tools engagement | ~190 installs / rating |
| 🔁 Tools D30 retention | 22% |
| 📍 DAU / MAU stickiness | 0.18 |
Heuristic guess from app bundle size, category, store description signals, and release-date stack era. Bumetric does not disassemble binaries — for binary-level certainty you would need an SDK intelligence tool or the manifest itself. Reasoning chain on the right. Full ruleset on /methodology.
| 🏷 Category context | Tools |
| 📦 Compact Android bundle | → Native Kotlin |
How we forecast this revenue
MEDIUM CONFIDENCEBU Investment Matrix
Concerning · 52/100BIG TIERbelow benchmarks- 💰 Revenue: Healthy — $280K - $1540K/mo · BIG tier · medium-low confidence, trajectory unclear.
- ⭐ Quality: 4.56★ across 1,294,136 reviews — exceptional (top 1% in category).
- 📍 Market: Not yet charting in any of the 9 monitored markets.
- 📈 Growth: Insufficient signal to assess trajectory.
- ⚠️ Risk: Low — no material risk signals detected.
💰 Forecast Revenue / mo
MODEL| High install base (1,294,136 ratings)METRIC | +$12,000 | |
| Excellent rating (4.6★)METRIC | +$2,200 | |
| excellent appREVIEW | +$1,500 | |
| slowREVIEW | −$1,200 | |
| Ad-supported / freemiumMETRIC | +$600 |
📈 Reviews Growth
LIVE⭐ Rating Trend
LIVEProfile & Insights
Identification
- App name
- My Verizon
- Developer
- Verizon Consumer Group
- Bundle ID
- com.vzw.hss.myverizon
- App Store URL
- Open in App Store
- Category
- Tools
- Content rating
- Not found
- Languages
- Not found
Company
- Website
- www.verizonwireless.com
- Tagline
- Not found
- Description
- Not found
- Founded
- Not found
- HQ / Address
- Not found
- Employees
- Not found
- Logo
- Not found
Revenue
- Verified revenue / mo
- Not found
- AI revenue estimate / mo
- Not found
- AI annual estimate
- Not found
- ML model estimate / mo
- $189/mo
- Top-grossing rank
- Not found
- All-time revenue
- Not found
- Pricing
- Not found
Founder
Funding
Press & Links
Contacts & Socials
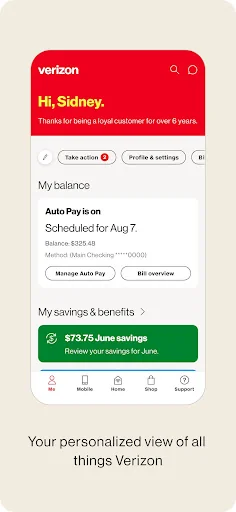
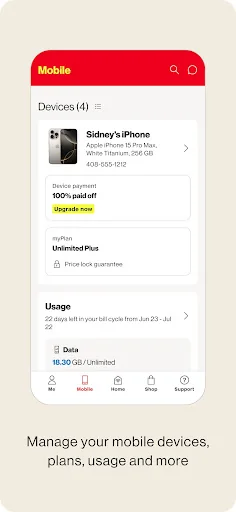
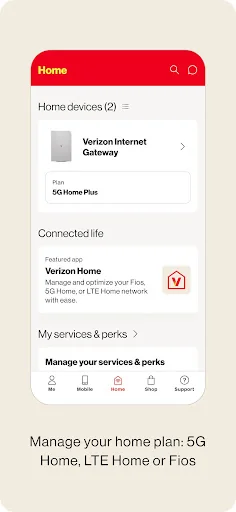
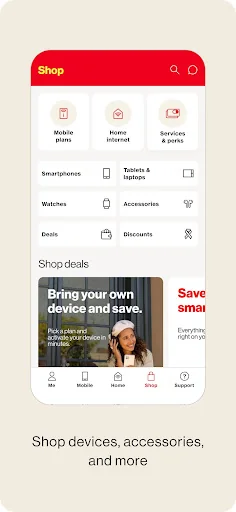
📝 About this app
Your Mobile and Home Internet accounts are just a tap away. Quickly manage your devices, make plan changes, view usage and discover everything your plan has to offer. Keep track of all your Home Internet accounts, 5G Home. LTE Home and Fios.… View full description on the official store →
What Worked™ · Development Pipeline
3 EVENTS TRACKEDTrack this app’s revenue
FREE📝 Description
95
More by Verizon Consumer Group
View all →


Why high confidence: 1,294,136 ratings · no founder-verified revenue (model estimate only).