CAMEO Chemicals
 54
54

CAMEO Chemicals
CAMEO Chemicals is an Android app from NOAA Office of Response and Restoration in the Tools category, currently rated 4.2★ across 251 ratings. Initial signal reads as largely positive sentiment, users highlighting consistency and feature depth.
Quality Score is 54: Solid (established niche player). For a Tools app, that means established niche player. The full BU Investment Matrix below scores 8 dimensions including monetisation, growth, and operational risk.
Track changes month-over-month in the Performance section below: live snapshot history and revenue forecast included.
- Title & subtitle keyword fit
- Description hook & conversion structure
- Screenshots, ratings, reviews strategy
📊 Performance Tracking LIVE
Synthetic estimate. Inputs: category complexity, file size, screen count, monetization layer, platform reach, age × team-size proxy. Calibrated against 2024-2026 indie-agency rate surveys. Full math + source list on /methodology.
| 🧱 MVP baseline (design + 1-store ship) | +$28K |
| 📱 5 unique screens × $4.5K | +$22K |
| ⚙ Tools complexity ×0.90 | $-5049 |
| 🌐 Cross-platform reach (iOS + Android) | +$24K |
Synthetic estimate from ratings × category benchmarks. Calibrated against 2024-2026 mobile-attribution retention + DAU/MAU reports. Numbers are US-storefront-equivalent — true global audience can be 5-10× larger for international apps. Full math + source list on /methodology.
| 📲 Tools engagement | ~190 installs / rating |
| 🔁 Tools D30 retention | 22% |
| 📍 DAU / MAU stickiness | 0.18 |
How we forecast this revenue
LOW CONFIDENCEBU Investment Matrix
Pre-traction · 39/100INDIE TIERlimited signal- 💰 Revenue: Marginal — $200 - $1250/mo · INDIE tier · medium confidence, trajectory unclear.
- ⭐ Quality: 4.22★ across 251 reviews — below category median.
- 📍 Market: Not yet charting in any of the 9 monitored markets.
- 📈 Growth: last update 187d ago — slow cadence.
- ⚠️ Risk: Low — no material risk signals detected.
💰 Forecast Revenue / mo
MODEL| excellent appREVIEW | +$1,500 | |
| Mature app (9y old)METRIC | +$1,500 | |
| Good rating (4.2★)METRIC | +$800 | |
| Ad-supported / freemiumMETRIC | +$600 | |
| Early-stage install base (251 ratings)METRIC | +$400 |
📈 Reviews Growth
LIVE⭐ Rating Trend
LIVEProfile & Insights
Identification
- App name
- CAMEO Chemicals
- Developer
- NOAA Office of Response and Restoration
- Bundle ID
- gov.noaa.cameochemical
- App Store URL
- Open in App Store
- Category
- Tools
- Content rating
- Not found
- Languages
- Not found
Company
- Website
- cameochemicals.noaa.gov
- Tagline
- Not found
- Description
- Not found
- Founded
- Not found
- HQ / Address
- Not found
- Employees
- Not found
- Logo
- Not found
Revenue
- Verified revenue / mo
- Not found
- AI revenue estimate / mo
- Not found
- AI annual estimate
- Not found
- ML model estimate / mo
- $144/mo
- Top-grossing rank
- Not found
- All-time revenue
- Not found
- Pricing
- Not found
Founder
Funding
Press & Links
Contacts & Socials
📈Ratings growth251 ratings+33% lifetimeShow 3-year history estimate ▾
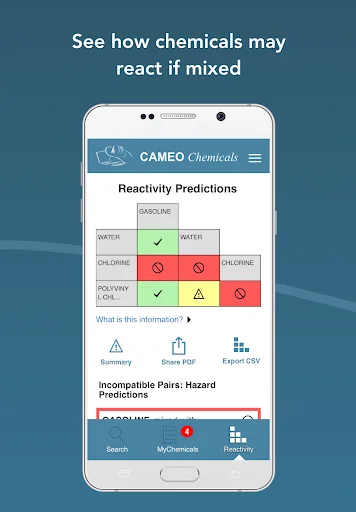
📝 About this app
<b>Key Program Features:</b>
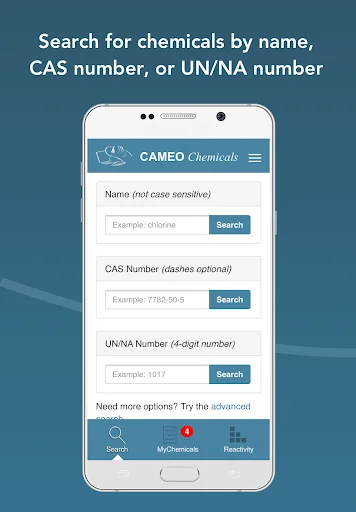
• <b>Search</b> by name, CAS number, or UN/NA number to find chemicals of interest in the extensive database of thousands of hazardous substances. Includes "type ahead" feature for simplified chemical name searches. An advanced search with additional search criteria is also available.… View full description on the official store →
Track this app’s revenue
FREE📝 Description
95


Why medium confidence: 251 ratings · no founder-verified revenue (model estimate only).