1.2M Android Apps Tracked Updated 15 min ago Revenue Forecasts
Add an app Create Account Sign In
Home

Payback 2 - The Battle Sandbox

82
Quality Score
Excellent

Payback 2 - The Battle Sandbox

High confidence
4.5 ✍️ Editor
✍️ bumetric analysis

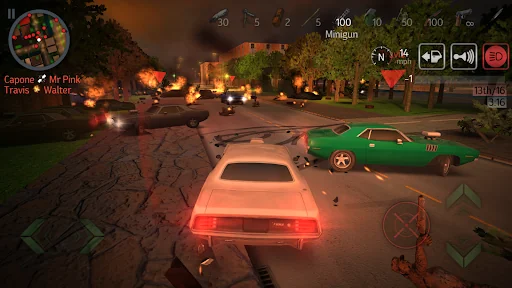
This Arcade title carves out a niche in chaotic, open-world action, directly competing with established sandbox crime games like *Grand Theft Auto: San Andreas* and similar titles offering diverse mission types. Its strong user rating, backed by over two million reviews, signals significant traction and a mature product with a loyal user base, likely past its initial growth spurt and now focused on retention and sustained engagement. As a free-to-play title in the Arcade category, a common monetization observation is the reliance on a hybrid model: a significant ad revenue component, often through interstitial and rewarded video ads, balanced with in-app purchases for cosmetic items, currency packs, or battle passes. Founders in this space often see a 60/40 or even 70/30 split favoring ad revenue over IAP, especially for games with high session counts and broad appeal.

BU Score 82 · Excellent — strong product-market fit. The full Investment Matrix below scores 8 dimensions including monetisation, growth, and operational risk.

Track snapshot history and revenue forecast in the Performance section below.

💰 Monthly revenue · now vs forecast
● Right now
$700K
per month
12-mo forecast
$741K – $1141K
per month
24-mo forecast
$886K – $1645K
per month
BIG tier
💡 Grow this revenue
Free AI audit of this app’s store listing
  • Title & subtitle keyword fit
  • Description hook & conversion structure
  • Screenshots, ratings, reviews strategy
Run free AI audit →
Typical impact: +2-5× organic installs
🔔Notify me when this app's revenue changes by

📊 Performance Tracking LIVE

Loading…
idle
0%
Rating
Reviews
Forecast Revenue / mo
Snapshots tracked
0
since first record
ONE-TIME · BUILD 💰 Estimated build cost
$175K
What it cost to build · not monthly revenue
Likely range $130K – $235K
$25K · MVP floor $100K · indie scale $500K+ · studio build
📈 Pays back in ~2.4y at current MRR

Synthetic estimate. Inputs: category complexity, file size, screen count, monetization layer, platform reach, age × team-size proxy. Calibrated against 2024-2026 indie-agency rate surveys. Full math + source list on /methodology.

Where the money goes
🧱 MVP baseline (design + 1-store ship) +$28K
📱 5 unique screens × $4.5K +$22K
💎 In-app purchase plumbing +$9K
Arcade complexity ×1.90 +$53K
🌐 Cross-platform reach (iOS + Android) +$62K
Total estimate $175K
ONE-TIME · EXIT VALUE 💵 Estimated acquisition value
$150K
What it would sell for · not monthly revenue
Marketplace range $125K – $200K · 26× MRR multiple
💸 ~0.9× build cost (under-water)

Synthetic estimate. Multiple band derived from iap / freemium model + age, rating quality, category demand, and user-base maturity. Calibrated against 2024-2026 indie-app-marketplace closed-deal medians. Full math + comparable deal list on /methodology.

How the multiple was built
💎 IAP / freemium model base 28× MRR
★ rating ≥ 4.4 (solid) +8%
🏷 Arcade category multiple -20%
Mature user base (1M+ ratings) +8%
Final multiple 26× MRR
👥 Estimated audience size
448.5M
Lifetime downloads (US-equivalent)
Monthly active
22.0M
Daily active
5.5M

Synthetic estimate from ratings × category benchmarks. Calibrated against 2024-2026 mobile-attribution retention + DAU/MAU reports. Numbers are US-storefront-equivalent — true global audience can be 5-10× larger for international apps. Full math + source list on /methodology.

How we sized it
📲 Arcade engagement ~200 installs / rating
🔁 Arcade D30 retention 5%
📍 DAU / MAU stickiness 0.25
DAU / MAU 25% sticky
🛠 Estimated tech stack
🤖
Native Android (Kotlin)
Medium confidence · 55%
Also possible
Flutter

Heuristic guess from app bundle size, category, store description signals, and release-date stack era. Bumetric does not disassemble binaries — for binary-level certainty you would need an SDK intelligence tool or the manifest itself. Reasoning chain on the right. Full ruleset on /methodology.

Signals we read
🏷 Category context Arcade
📦 Tiny game bundle → Native 2D engine
🔬

How we forecast this revenue

MEDIUM CONFIDENCE
Baseline
$700K/mo · ML-estimated from 234 triggers
Growth rate
+2.5% MoM · BIG tier baseline (compound monthly)
6 months
$690K – $933K
12 months
$741K – $1.1M
24 months
$886K – $1.6M
Compound growth at +2.5% MoM (tier baseline for BIG). Range widens with horizon — typical noise band ±15% at 6mo.. Ranges widen with horizon — distant futures carry more uncertainty.
📊

BU Investment Matrix

Mixed signals · 57/100BIG TIERcompetitive but cautious
RevenueQualityMarketGrowthMoatSafetyFounderMonetiz.
Revenue Strength
5.8
Product Quality
9.1
Market Position
0.0
Growth Velocity
5.0
Defensibility
7.0
Operational Safety
9.0
Founder Strength
4.8
Monetization Maturity
5.0
  • 💰 Revenue: Healthy — $280K - $1540K/mo · BIG tier · medium-low confidence, trajectory unclear.
  • ⭐ Quality: 4.53★ across 2,243,638 reviews — exceptional (top 1% in category).
  • 📍 Market: Not yet charting in any of the 9 monitored markets.
  • 📈 Growth: last update 310d ago — slow cadence.
  • ⚠️ Risk: Low — no material risk signals detected.
🎯 For competitors: Mixed picture. Worth competing if you have a clear UX or pricing edge — otherwise crowded segment.
💵 For acquirers: Estimated asking range 18-32× monthly = $12.6M-$22.4M.
Composite of 8 dimensions computed deterministically from public signals — no LLM, every score traces back to a measurable input. Default weights shown; "compete" / "acquire" / "invest" lenses re-weight without re-fetching.
Range:

💰 Forecast Revenue / mo

MODEL
Revenue forecast computed from BU's 234 trigger model on each snapshot. Calibrated against ground-truth from 58 verified-revenue apps.
🔬Forecast Breakdown — Why This Estimate?Top 4 of 4 triggers
Our ML model uses 200+ signals from public data. These are the most influential for this app:
High install base (2,243,638 ratings)METRIC
+$12,000
Excellent rating (4.5★)METRIC
+$2,200
Mature app (11y old)METRIC
+$1,500
Ad-supported / freemiumMETRIC
+$600
METRIC = structural app data · REVIEW = mined from user reviews · ✓ VERIFIED = Stripe-verified anchor (TrustMRR)

📈 Reviews Growth

LIVE
Cumulative review count from first BU snapshot. Each point = a tracked update.

⭐ Rating Trend

LIVE
Average rating evolution. Updates with each new review batch.

Profile & Insights

Everything we know — and don't — about this app and its company.

Identification

App name
Payback 2 - The Battle Sandbox
Developer
Apex Designs Games LLP
Bundle ID
net.apex_designs.payback2
App Store URL
Open in App Store
Category
Arcade
Content rating
Not found
Languages
Not found

Company

Website
www.apex-designs.net
Tagline
Not found
Description
Not found
Founded
Not found
HQ / Address
Not found
Employees
Not found
Logo
Not found

Revenue

Verified revenue / mo
Not found
AI revenue estimate / mo
Not found
AI annual estimate
Not found
ML model estimate / mo
$6.0K/mo
Top-grossing rank
Not found
All-time revenue
Not found
Pricing
$0.99 - $14.99 per item

Founder

Founder data not yet collected for this app.

Funding

Funding data not yet collected for this app.

Press & Links

Press & Links data not yet collected for this app.

Contacts & Socials

Contacts & Socials data not yet collected for this app.
📈Ratings growth2,243,638 ratings+26% lifetimeShow 3-year history estimate ▾Jul 2023Feb 2025Jul 2026
Tracked (2 weeks) Pre-tracking estimate (37 weeks) · model-based, ±5% noise · anchored to release date and current value
Profile is built from iTunes Lookup + developer site scrape + ML revenue model. Empty fields show "Not found" — additional sources (Crunchbase, X, IndieHackers, Acquire.com) coming.

📝 About this app

Gaming App of The Day - Kotaku.com

"[Payback 2] manages to create a sense of overblown fun that permeates everything from straightforward races to capture the flag-inspired heists ... an immensely entertaining experience" - pocketgamer.co.uk

Featured as one of the best games of the week by The Guardian

"There’s a ton of stuff to do which is what gives Payback 2 such an interesting atmosphere" - Super Game Droid

Android Authority's Indie App of the Day

DESCRIPTION:… View full description on the official store →
App Specs
🔐 Own this app? Claim & verify MRR →
🔖 v2.106.16🔄 updated 0d ago📂 Arcade💰 Free📺 Ad-supported💎 IAP $0.99 - $14.99 per item
🔔

Track this app’s revenue

FREE
Get an email when revenue moves by your threshold. No spam, unsubscribe in one click.

📝 Description

95
BU Score · Transcendent
Full revenue analysis
Read the article-style breakdown for Payback 2 - The Battle Sandbox: category rank, percentile, growth signal, comparable apps, and how the forecast is calibrated against verified-MRR anchors in this niche.
Read deep-dive →

Similar apps in Arcade

About this analysis
ZCAnalyzed by Zakhar Chumak · founder, bumetric·Full methodology·High confidence

Why high confidence: 2,243,638 ratings · no founder-verified revenue (model estimate only).

Frequently Asked Questions

4 answers · auto-generated from this app's public data
How much does Payback 2 - The Battle Sandbox make per month?
Based on our ML-calibrated revenue forecast, Payback 2 - The Battle Sandbox earns approximately $6.0K/mo. This is a US-storefront-equivalent estimate; global revenue can be several times larger for internationally-distributed apps. See the methodology page for the full formula and confidence bands.
What apps are like Payback 2 - The Battle Sandbox?
Browse the full Arcade category catalog to find similar apps with revenue, build cost, audience and tech stack data. Each /p/{slug} page also shows a Compare side-by-side widget with three peer apps from the same niche.
Who makes Payback 2 - The Battle Sandbox?
Payback 2 - The Battle Sandbox is published by Apex Designs Games LLP on the Google Play Store. See the full publisher portfolio (other apps by the same developer) via the More by developer block on the product page above.
What is Payback 2 - The Battle Sandbox's BU Score?
Payback 2 - The Battle Sandbox has a BU Score of 82/100 (Excellent). The score combines App Store rating, ratings count, monetization model and revenue signals calibrated against founder-verified MRR anchors. See the BU Score formula.