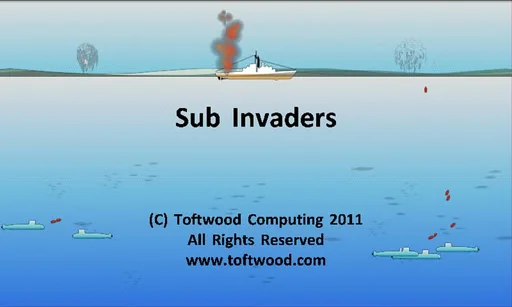
Sub Invaders


 55
55


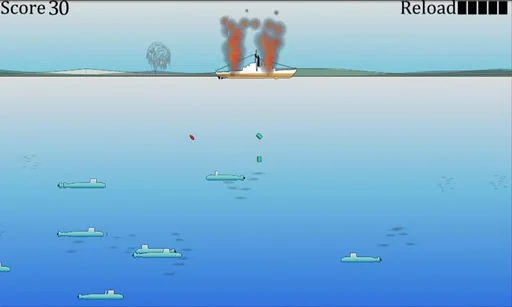
Sub Invaders
Sub Invaders is an Android app from Toftwood Games in the Arcade category, currently rated 4.5★ across 89 ratings. Initial signal reads as mixed reviews: supporters praise core features while critics cite stability and value gaps.
Quality Score is 55: Solid (established niche player). For a Arcade app, that means established niche player. The full BU Investment Matrix below scores 8 dimensions including monetisation, growth, and operational risk.
Track changes month-over-month in the Performance section below: live snapshot history and revenue forecast included.
- Title & subtitle keyword fit
- Description hook & conversion structure
- Screenshots, ratings, reviews strategy
📊 Performance Tracking LIVE
Synthetic estimate. Inputs: category complexity, file size, screen count, monetization layer, platform reach, age × team-size proxy. Calibrated against 2024-2026 indie-agency rate surveys. Full math + source list on /methodology.
| 🧱 MVP baseline (design + 1-store ship) | +$28K |
| 📱 5 unique screens × $4.5K | +$22K |
| ⚙ Arcade complexity ×1.90 | +$45K |
| 🌐 Cross-platform reach (iOS + Android) | +$52K |
Heuristic guess from app bundle size, category, store description signals, and release-date stack era. Bumetric does not disassemble binaries — for binary-level certainty you would need an SDK intelligence tool or the manifest itself. Reasoning chain on the right. Full ruleset on /methodology.
| 🏷 Category context | Arcade |
| 📦 Tiny game bundle | → Native 2D engine |
How we forecast this revenue
LOW CONFIDENCEBU Investment Matrix
Early-stage solo · 44/100INDIE TIERexpected for tier- 💰 Revenue: Marginal — $200 - $1250/mo · INDIE tier · medium confidence, trajectory unclear.
- ⭐ Quality: 4.5★ across 89 reviews — weak — significant quality concerns.
- 📍 Market: Not yet charting in any of the 9 monitored markets.
- 📈 Growth: last update 257d ago — slow cadence.
- ⚠️ Risk: Low — no material risk signals detected.
💰 Forecast Revenue / mo
MODEL| Excellent rating (4.5★)METRIC | +$2,200 | |
| Mature app (14y old)METRIC | +$1,500 | |
| Ad-supported / freemiumMETRIC | +$600 | |
| Pre-traction phase (89 ratings)METRIC | −$300 |
📈 Reviews Growth
LIVE⭐ Rating Trend
LIVEProfile & Insights
Identification
- App name
- Sub Invaders
- Developer
- Toftwood Games
- Bundle ID
- toftwood.games.subinvaders
- App Store URL
- Open in App Store
- Category
- Arcade
- Content rating
- Not found
- Languages
- Not found
Company
- Website
- www.toftwood.com
- Tagline
- Not found
- Description
- Not found
- Founded
- Not found
- HQ / Address
- Not found
- Employees
- Not found
- Logo
- Not found
Revenue
- Verified revenue / mo
- Not found
- AI revenue estimate / mo
- Not found
- AI annual estimate
- Not found
- ML model estimate / mo
- $220/mo
- Top-grossing rank
- Not found
- All-time revenue
- Not found
- Pricing
- Not found
Founder
Funding
Press & Links
Contacts & Socials
📈Ratings growth89 ratings+46% lifetimeShow 3-year history estimate ▾
📝 About this app
Track this app’s revenue
FREE📝 Description
95
More by Toftwood Games
View all →


Why low confidence: only 89 ratings · no founder-verified revenue (model estimate only) · revenue figure is directional only.