29K iOS Apps Tracked Updated 2 min ago Revenue Forecasts
Add an app Create Account Sign In
Home

Savings Goals Pro

66
Quality Score
Solid

Savings Goals Pro

Low confidence
4.9 ✍️ Editor
✍️ bumetric analysis

Savings Goals Pro is an iOS app from MoneyBudgie in the Finance category, currently rated 4.9★ across 21 ratings. Initial signal reads as largely positive sentiment, users highlighting consistency and feature depth.

Quality Score is 66: Solid (established niche player). For a Finance app, that means established niche player. The full BU Investment Matrix below scores 8 dimensions including monetisation, growth, and operational risk.

Track changes month-over-month in the Performance section below: live snapshot history and revenue forecast included.

💰 Monthly revenue · now vs forecast
● Right now
$5.0K
per month
12-mo forecast
$5.2K – $10.8K
per month
24-mo forecast
$6.4K – $19.2K
per month
MID tier
💡 Grow this revenue
Free AI audit of this app’s store listing
  • Title & subtitle keyword fit
  • Description hook & conversion structure
  • Screenshots, ratings, reviews strategy
Run free AI audit →
Typical impact: +2-5× organic installs
🔔Notify me when this app's revenue changes by

📊 Performance Tracking LIVE

Loading…
idle
0%
Rating
Reviews
Forecast Revenue / mo
Snapshots tracked
0
since first record
ONE-TIME · BUILD 💰 Estimated build cost
$80K
What it cost to build · not monthly revenue
Likely range $60K – $110K
$25K · MVP floor $100K · indie scale $500K+ · studio build
📈 Pays back in ~7 months at current MRR

Synthetic estimate. Inputs: category complexity, file size, screen count, monetization layer, platform reach, age × team-size proxy. Calibrated against 2024-2026 indie-agency rate surveys. Full math + source list on /methodology.

Where the money goes
🧱 MVP baseline (design + 1-store ship) +$28K
📱 5 unique screens × $4.5K +$22K
Finance complexity ×1.60 +$30K
Total estimate $80K
ONE-TIME · EXIT VALUE 💵 Estimated acquisition value
$200K
What it would sell for · not monthly revenue
Marketplace range $150K – $275K · 18× MRR multiple
💸 ~2.5× return on build cost

Synthetic estimate. Multiple band derived from ad-supported + age, rating quality, category demand, and user-base maturity. Calibrated against 2024-2026 indie-app-marketplace closed-deal medians. Full math + comparable deal list on /methodology.

How the multiple was built
📺 Ad-supported base 15× MRR
★ rating ≥ 4.7 (premium) +15%
🏷 Finance category multiple +15%
Small user base (<1K ratings) -8%
Final multiple 18× MRR
🔬

How we forecast this revenue

MEDIUM CONFIDENCE
Baseline
$5.0K/mo · ML-estimated from 234 triggers
Growth rate
+4.0% MoM · MID tier baseline (compound monthly)
Direction
Headwinds: rating drift may slow acquisition
6 months
$4.7K – $7.9K
12 months
$5.2K – $10.8K
24 months
$6.4K – $19.2K
Compound growth at +4.0% MoM (tier baseline for MID). Range widens with horizon — typical noise band ±25% at 6mo.. Ranges widen with horizon — distant futures carry more uncertainty.
📊

BU Investment Matrix

Below median · 44/100MID TIERunderperforming peers
GrowthFounderQualityRevenueMonetiz.MoatMarketSafety
Growth Velocity
5.0
Founder Strength
6.2
Product Quality
3.9
Revenue Strength
3.7
Monetization Maturity
1.0
Defensibility
6.0
Market Position
2.0
Operational Safety
7.0
  • 💰 Revenue: Modest — $3K - $7K/mo · MID tier · medium confidence, trajectory unclear.
  • ⭐ Quality: 4.9★ across 21 reviews — weak — significant quality concerns.
  • 📍 Market: Not yet charting in any of the 9 monitored markets.
  • 📈 Growth: ⚠ last update 877d ago — possibly dormant.
  • ⚠️ Risk: Moderate — dormant (877d since update).
🎯 For competitors: Mixed picture. Worth competing if you have a clear UX or pricing edge — otherwise crowded segment.
💵 For acquirers: Estimated asking range 18-32× monthly = $90K-$160K. Portfolio play ($33K/mo combined) commands premium.
Composite of 8 dimensions computed deterministically from public signals — no LLM, every score traces back to a measurable input. Default weights shown; "compete" / "acquire" / "invest" lenses re-weight without re-fetching.
Range:

💰 Forecast Revenue / mo

MODEL
Revenue forecast computed from BU's 234 trigger model on each snapshot. Calibrated against ground-truth from 58 verified-revenue apps.
🔬Forecast Breakdown — Why This Estimate?Top 6 of 6 triggers
Our ML model uses 200+ signals from public data. These are the most influential for this app:
Paid app ($0.00)METRIC
+$2,800
Excellent rating (4.9★)METRIC
+$2,200
5 starREVIEW
+$1,800
Mature app (14y old)METRIC
+$1,500
Single-language (English only)METRIC
−$400
Pre-traction phase (21 ratings)METRIC
−$300
METRIC = structural app data · REVIEW = mined from user reviews · ✓ VERIFIED = Stripe-verified anchor (TrustMRR)

📈 Reviews Growth

LIVE
Cumulative review count from first BU snapshot. Each point = a tracked update.

⭐ Rating Trend

LIVE
Average rating evolution. Updates with each new review batch.

🆕 What's New · v4.38

Bug fixes & minor improvements.

Profile & Insights

Everything we know — and don't — about this app and its company.

Identification

App name
Savings Goals Pro
Developer
MoneyBudgie
Bundle ID
com.corbenicconsulting.savingsgoals
App Store URL
Open in App Store
Category
Finance
Content rating
4+
Languages
EN

Company

Website
Not found
Tagline
Not found
Description
Not found
Founded
Not found
HQ / Address
Not found
Employees
Not found
Logo
Not found

Revenue

Verified revenue / mo
Not found
AI revenue estimate / mo
Not found
AI annual estimate
Not found
ML model estimate / mo
$11.6K/mo
Top-grossing rank
Outside top 100 in US Finance
All-time revenue
Not found
Pricing
Not found

Founder

Founder data not yet collected for this app.

Funding

Funding data not yet collected for this app.

Press & Links

Press & Links data not yet collected for this app.

Contacts & Socials

Contacts & Socials data not yet collected for this app.
📈Ratings growth21 ratings+2000% lifetimeShow 3-year history estimate ▾Apr 2012Apr 2016Jun 2026
Tracked (45 weeks) Pre-tracking estimate (37 weeks) · model-based, ±5% noise · anchored to release date and current value
🌍Geographic ReachNot ranked
This app is currently outside the top 100 grossing in all 9 countries we monitor (US, UK, DE, FR, JP, CA, AU, BR, IN). Niche or new apps often launch this way — popularity rankings appear once daily revenue clears the regional threshold.
💰Pricing History$0.00 → $4.99 (+0%)
Profile is built from iTunes Lookup + developer site scrape + ML revenue model. Empty fields show "Not found" — additional sources (Crunchbase, X, IndieHackers, Acquire.com) coming.

📝 About this app

◆ Featured in the Telegraph Must-Have Apps List in the UK

◆ Featured in The Independent UK Newspaper

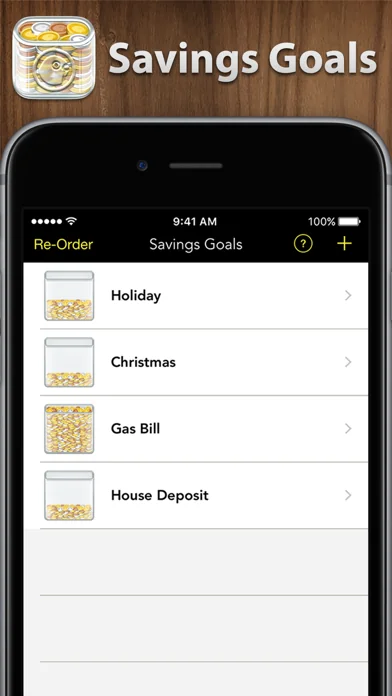
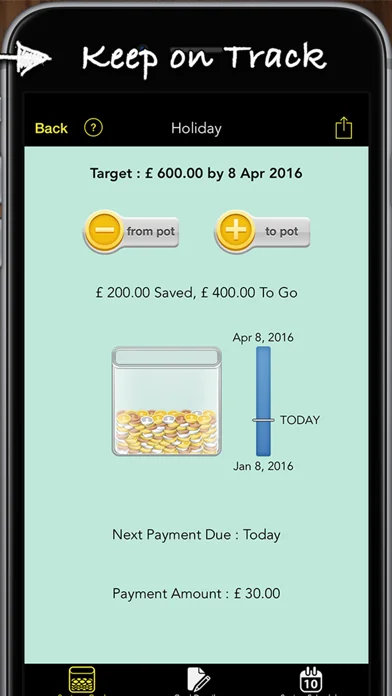
Are you saving for a house deposit, new car, holiday, household bill etc or putting money aside just in case?

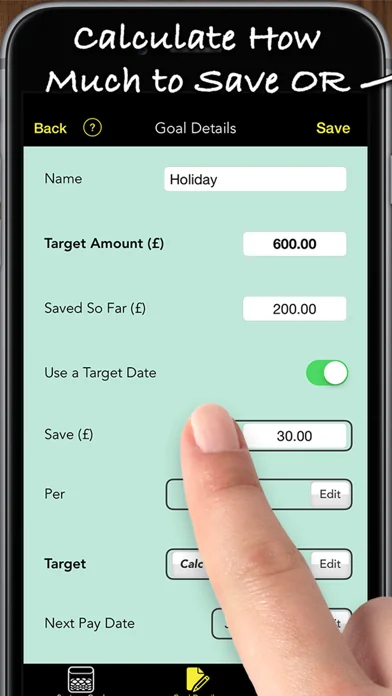
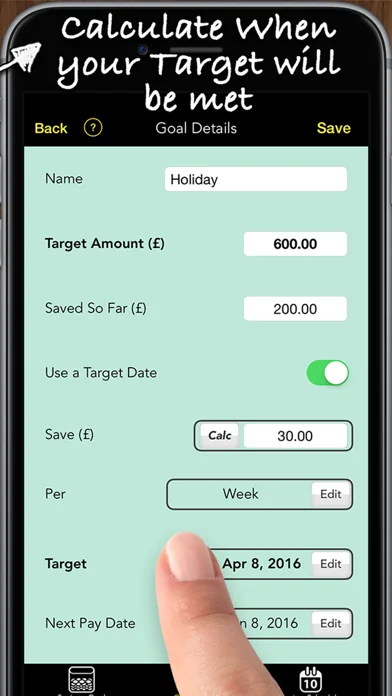
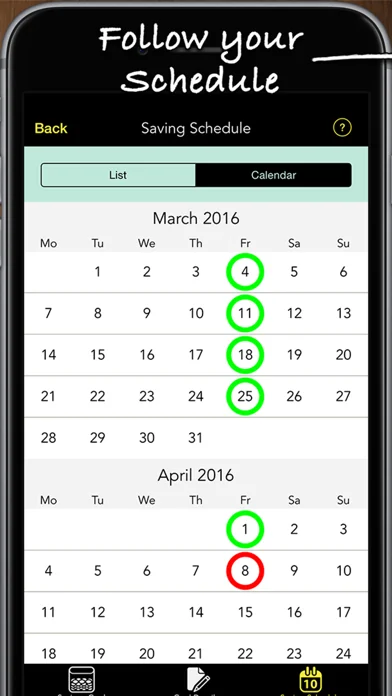
Buy 'Savings Goals' and track your progress when saving. You enter a target amount and an optional target date by which you want to save this amount and the app suggests a savings schedule and tracks your progress. You can have as many separate Savings Goals as you need.

◆ Use a Target Date and the App will :… View full description on the official store →
App Specs
🔐 Own this app? Claim & verify MRR →
💾 10 MB🔞 4+📱 iOS 14.0+🔖 v4.38🔄 updated 0d ago🌐 EN📂 Finance💰 Paid
📅

What Worked™ · Development Pipeline

6 EVENTS TRACKED
Detected changes in this app over its tracked lifetime — each event links cause (what changed) to effect (what moved). Sorted newest first.See full history →Version history →
2026-05
💲
Went paid — introduced $4.99 price point
2026-03
Rating ↑ 4.41 → 4.80 (improved 0.39★)
2012-10
📈
Crossed 10 ratings — social-proof flywheel kicking in
2012-06
Rating ↓ 4.67 → 4.25 (dropped 0.42★)
2012-05
Rating ↑ 4.00 → 4.50 (improved 0.50★)
2012-04
🚀
First tracked snapshot — initial data captured
🌍

Multi-Country Performance

Available in 9 of 9 monitored markets
MarketRatingReviewsCurrent version
🇦🇺 AU4.81818★114.81818★ this version
🇧🇷 BR5★15★ this version
🇨🇦 CA5★45★ this version
🇩🇪 DE0★0
🇫🇷 FR0★0
🇬🇧 GB4.8★154.8★ this version
🇮🇳 IN3★23★ this version
🇯🇵 JP0★0
🇺🇸 US4.90475★214.90475★ this version
🔔

Track this app’s revenue

FREE
Get an email when revenue moves by your threshold. No spam, unsubscribe in one click.

📝 Description

95
BU Score · Transcendent

More by MoneyBudgie

View all →
📦 Portfolio summaryINDIE studio
4apps·$33K/mocombined
✓ Diversified — top app contributes 35%; risk spread across portfolio

Similar apps in Finance

About this analysis
ZCAnalyzed by Zakhar Chumak · founder, bumetric·Full methodology·Low confidence

Why low confidence: only 21 ratings · no founder-verified revenue (model estimate only) · revenue figure is directional only.

📌 Final verdict — read this before you trust the numbers above

Savings Goals Pro is a small / niche iOS app in the finance space with weak public traction — only 21 ratings, no founder-verified MRR, and not ranked in any monitored grossing chart. The app appears to be monetised, but public signals are too sparse for a precise revenue estimate.

Bottom line: treat all revenue, audience and acquisition-value numbers on this page as directional only — not founder-verified facts.

Frequently Asked Questions

4 answers · auto-generated from this app's public data
How much does Savings Goals Pro make per month?
Our model estimates Savings Goals Pro earns roughly $11K/mo, but with only 21 ratings the confidence interval is wide. No founder-verified MRR is available for this app, so this is a model output calibrated against comparable apps in the same category. See methodology for the formula.
What apps are like Savings Goals Pro?
Browse the full Finance category catalog to find similar apps with revenue, build cost, audience and tech stack data. Each /p/{slug} page also shows a Compare side-by-side widget with three peer apps from the same niche.
Who makes Savings Goals Pro?
Savings Goals Pro is published by MoneyBudgie on the Apple App Store. See the full publisher portfolio (other apps by the same developer) via the More by developer block on the product page above.
What is Savings Goals Pro's BU Score?
Savings Goals Pro has a BU Score of 66/100 (Solid). The score combines App Store rating, ratings count, monetization model and revenue signals calibrated against founder-verified MRR anchors. See the BU Score formula.