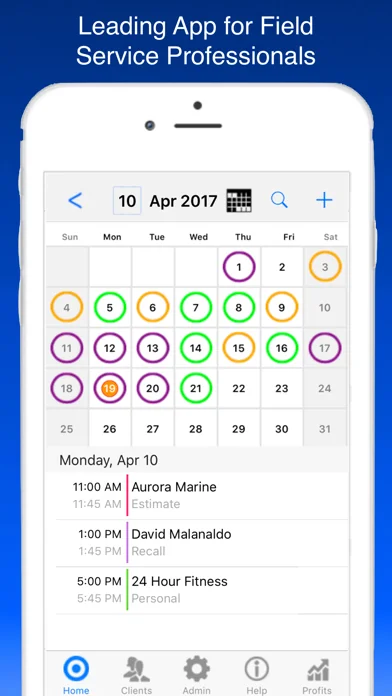
Service Tech Work Orders Plus

 53
53


Service Tech Work Orders Plus
Service Tech Work Orders Plus is an iOS app from JZ Mobile LLC in the Business category, currently rated 4.2★ across 13 ratings. Initial signal reads as largely positive sentiment, users highlighting consistency and feature depth.
Quality Score is 53: Solid (established niche player). For a Business app, that means established niche player. The full BU Investment Matrix below scores 8 dimensions including monetisation, growth, and operational risk.
Track changes month-over-month in the Performance section below: live snapshot history and revenue forecast included.
- Title & subtitle keyword fit
- Description hook & conversion structure
- Screenshots, ratings, reviews strategy
📊 Performance Tracking LIVE
Synthetic estimate. Inputs: category complexity, file size, screen count, monetization layer, platform reach, age × team-size proxy. Calibrated against 2024-2026 indie-agency rate surveys. Full math + source list on /methodology.
| 🧱 MVP baseline (design + 1-store ship) | +$28K |
| 📱 5 unique screens × $4.5K | +$22K |
| 📦 Asset bundle (124 MB) | +$29K |
| ⚙ Business complexity ×1.50 | +$40K |
Synthetic estimate. Multiple band derived from ad-supported + age, rating quality, category demand, and user-base maturity. Calibrated against 2024-2026 indie-app-marketplace closed-deal medians. Full math + comparable deal list on /methodology.
| 📺 Ad-supported base | 15× MRR |
| 🏷 Business category multiple | +10% |
| ⭐ Small user base (<1K ratings) | -8% |
How we forecast this revenue
MEDIUM CONFIDENCEBU Investment Matrix
Below median · 49/100MID TIERunderperforming peers- 💰 Revenue: Modest — $3K - $7K/mo · MID tier · medium confidence, trajectory unclear.
- ⭐ Quality: 4.23★ across 13 reviews — weak — significant quality concerns.
- 📍 Market: Not yet charting in any of the 9 monitored markets.
- 📈 Growth: last update 213d ago — slow cadence.
- ⚠️ Risk: Low — no material risk signals detected.
💰 Forecast Revenue / mo
MODEL| Paid app ($0.00)METRIC | +$2,800 | |
| Mature app (12y old)METRIC | +$1,500 | |
| support teamREVIEW | +$900 | |
| Good rating (4.2★)METRIC | +$800 | |
| Single-language (English only)METRIC | −$400 | |
| Pre-traction phase (13 ratings)METRIC | −$300 |
📈 Reviews Growth
LIVE⭐ Rating Trend
LIVE🆕 What's New · v26
Profile & Insights
Identification
- App name
- Service Tech Work Orders Plus
- Developer
- JZ Mobile LLC
- Bundle ID
- serviceman
- App Store URL
- Open in App Store
- Category
- Business
- Content rating
- 4+
- Languages
- EN
Company
- Website
- Not found
- Tagline
- Today
- Description
- Find apps and games for iPhone, iPad, Mac, and more on the App Store.
- Founded
- Not found
- HQ / Address
- Not found
- Employees
- Not found
- Logo
- Available
Revenue
- Verified revenue / mo
- Not found
- AI revenue estimate / mo
- Not found
- AI annual estimate
- Not found
- ML model estimate / mo
- $5.3K/mo
- Top-grossing rank
- Outside top 100 in US Business
- All-time revenue
- Not found
- Pricing
- Not found
Founder
Funding
Press & Links
Contacts & Socials
📈Ratings growth13 ratings+1200% lifetimeShow 3-year history estimate ▾
📝 About this app
Reasonable One-Time Price
There are no monthly or annual fees to use your app.
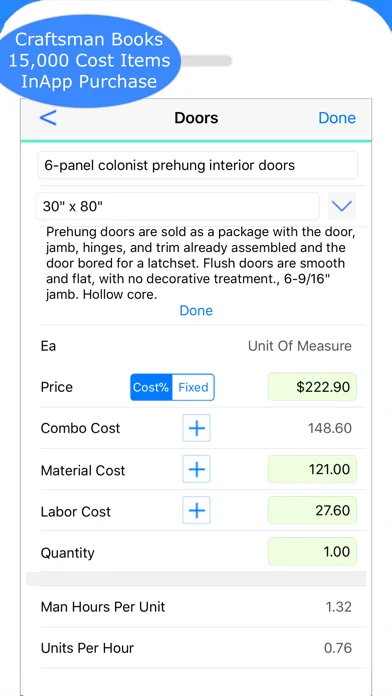
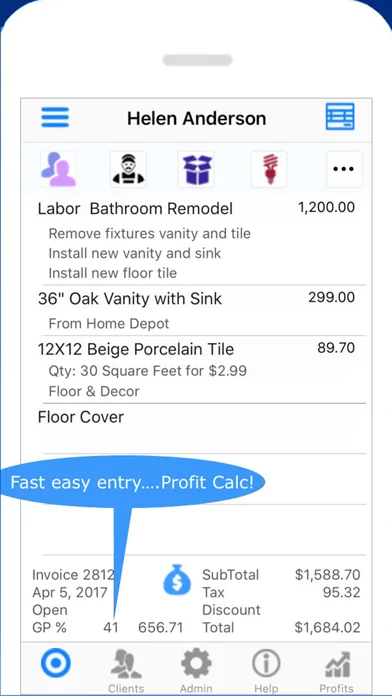
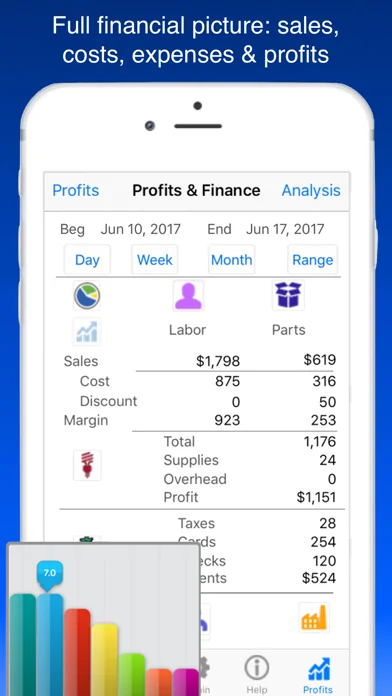
Powerful invoicing function is included to create, email and print all types of sales and service invoices. Invoice entry you can visualize the completed invoice as you go.… View full description on the official store →
What Worked™ · Development Pipeline
5 EVENTS TRACKEDMulti-Country Performance
Available in 9 of 9 monitored markets| Market | Rating | Reviews | Current version |
|---|---|---|---|
| 🇦🇺 AU | 0★ | 0 | — |
| 🇧🇷 BR | 0★ | 0 | — |
| 🇨🇦 CA | 0★ | 0 | — |
| 🇩🇪 DE | 0★ | 0 | — |
| 🇫🇷 FR | 0★ | 0 | — |
| 🇬🇧 GB | 0★ | 0 | — |
| 🇮🇳 IN | 0★ | 0 | — |
| 🇯🇵 JP | 0★ | 0 | — |
| 🇺🇸 US | 4.23076★ | 13 | 4.23076★ this version |
Track this app’s revenue
FREE📝 Description
95
More by JZ Mobile LLC
View all →


Similar apps in Business


Why low confidence: only 13 ratings · no founder-verified revenue (model estimate only) · revenue figure is directional only.
Service Tech Work Orders Plus is a early-stage iOS app in the business space with weak public traction — only 13 ratings, no founder-verified MRR, and not ranked in any monitored grossing chart. The app appears to be monetised, but public signals are too sparse for a precise revenue estimate.
Bottom line: treat all revenue, audience and acquisition-value numbers on this page as directional only — not founder-verified facts.