29K iOS Apps Tracked Updated 3 min ago Revenue Forecasts
Add an app Create Account Sign In
Home

Stocks Live+ Best Stock Market

67
Quality Score
Solid

Stocks Live+ Best Stock Market

Medium confidence
4.2 ✍️ Editor
✍️ bumetric analysis

Stocks Live+ Best Stock Market is an iOS app from Cinnamon Mobile LLC in the Finance category, currently rated 4.2★ across 1,002 ratings. Initial signal reads as largely positive sentiment, users highlighting consistency and feature depth.

Quality Score is 67: Solid (established niche player). For a Finance app, that means established niche player. The full BU Investment Matrix below scores 8 dimensions including monetisation, growth, and operational risk.

Track changes month-over-month in the Performance section below: live snapshot history and revenue forecast included.

💰 Monthly revenue · now vs forecast
● Right now
$5.8K
per month
12-mo forecast
$6.0K – $12.6K
per month
24-mo forecast
$7.5K – $22.4K
per month
MID tier
💡 Grow this revenue
Free AI audit of this app’s store listing
  • Title & subtitle keyword fit
  • Description hook & conversion structure
  • Screenshots, ratings, reviews strategy
Run free AI audit →
Typical impact: +2-5× organic installs
🔔Notify me when this app's revenue changes by

📊 Performance Tracking LIVE

Loading…
idle
0%
Rating
Reviews
Forecast Revenue / mo
Snapshots tracked
0
since first record
ONE-TIME · BUILD 💰 Estimated build cost
$80K
What it cost to build · not monthly revenue
Likely range $60K – $110K
$25K · MVP floor $100K · indie scale $500K+ · studio build
📈 Pays back in ~7 months at current MRR

Synthetic estimate. Inputs: category complexity, file size, screen count, monetization layer, platform reach, age × team-size proxy. Calibrated against 2024-2026 indie-agency rate surveys. Full math + source list on /methodology.

Where the money goes
🧱 MVP baseline (design + 1-store ship) +$28K
📱 5 unique screens × $4.5K +$22K
Finance complexity ×1.60 +$30K
Total estimate $80K
ONE-TIME · EXIT VALUE 💵 Estimated acquisition value
$200K
What it would sell for · not monthly revenue
Marketplace range $150K – $275K · 17× MRR multiple
💸 ~2.5× return on build cost

Synthetic estimate. Multiple band derived from ad-supported + age, rating quality, category demand, and user-base maturity. Calibrated against 2024-2026 indie-app-marketplace closed-deal medians. Full math + comparable deal list on /methodology.

How the multiple was built
📺 Ad-supported base 15× MRR
🏷 Finance category multiple +15%
Final multiple 17× MRR
👥 Estimated audience size
60K
Lifetime downloads (US-equivalent)
Monthly active
16K
Daily active
6.6K

Synthetic estimate from ratings × category benchmarks. Calibrated against 2024-2026 mobile-attribution retention + DAU/MAU reports. Numbers are US-storefront-equivalent — true global audience can be 5-10× larger for international apps. Full math + source list on /methodology.

How we sized it
📲 Finance engagement ~60 installs / rating
🔁 Finance D30 retention 28%
📍 DAU / MAU stickiness 0.40
DAU / MAU 40% sticky
🔬

How we forecast this revenue

MEDIUM CONFIDENCE
Baseline
$5.8K/mo · ML-estimated from 234 triggers
Growth rate
+4.0% MoM · MID tier baseline (compound monthly)
6 months
$5.5K – $9.2K
12 months
$6.0K – $12.6K
24 months
$7.5K – $22.4K
Compound growth at +4.0% MoM (tier baseline for MID). Range widens with horizon — typical noise band ±25% at 6mo.. Ranges widen with horizon — distant futures carry more uncertainty.
📊

BU Investment Matrix

Below median · 50/100MID TIERunderperforming peers
RevenueQualityMarketGrowthMoatSafetyFounderMonetiz.
Revenue Strength
3.8
Product Quality
7.6
Market Position
0.0
Growth Velocity
5.0
Defensibility
6.0
Operational Safety
10.0
Founder Strength
6.3
Monetization Maturity
1.0
  • 💰 Revenue: Modest — $4K - $8K/mo · MID tier · medium confidence, trajectory unclear.
  • ⭐ Quality: 4.2★ across 1,002 reviews — strong (top 10%).
  • 📍 Market: Not yet charting in any of the 9 monitored markets.
  • 📈 Growth: Insufficient signal to assess trajectory.
  • ⚠️ Risk: Low — no material risk signals detected.
🎯 For competitors: Mixed picture. Worth competing if you have a clear UX or pricing edge — otherwise crowded segment.
💵 For acquirers: Estimated asking range 18-32× monthly = $104K-$186K. Portfolio play ($40K/mo combined) commands premium.
Composite of 8 dimensions computed deterministically from public signals — no LLM, every score traces back to a measurable input. Default weights shown; "compete" / "acquire" / "invest" lenses re-weight without re-fetching.
Range:

💰 Forecast Revenue / mo

MODEL
Revenue forecast computed from BU's 234 trigger model on each snapshot. Calibrated against ground-truth from 58 verified-revenue apps.
🔬Forecast Breakdown — Why This Estimate?Top 15 of 15 triggers
Our ML model uses 200+ signals from public data. These are the most influential for this app:
Paid app ($0.00)METRIC
+$2,800
worth every pennyREVIEW
+$2,000
bugsREVIEW
−$1,800
5 starREVIEW
+$1,800
great valueREVIEW
+$1,600
cancelledREVIEW
−$1,500
excellent appREVIEW
+$1,500
Low install base (1,002 ratings)METRIC
+$1,500
Mature app (14y old)METRIC
+$1,500
highly recommendREVIEW
+$1,400
slowREVIEW
−$1,200
too expensiveREVIEW
−$1,000
priceyREVIEW
−$800
Good rating (4.2★)METRIC
+$800
Localized (9 languages)METRIC
+$600
METRIC = structural app data · REVIEW = mined from user reviews · ✓ VERIFIED = Stripe-verified anchor (TrustMRR)

📈 Reviews Growth

LIVE
Cumulative review count from first BU snapshot. Each point = a tracked update.

⭐ Rating Trend

LIVE
Average rating evolution. Updates with each new review batch.

🆕 What's New · v39.8

• Improved price display logic for What-If positions. Previously, manually entered positions could incorrectly show extended hours prices instead of the user-defined price.… Full release notes →

Profile & Insights

Everything we know — and don't — about this app and its company.

Identification

App name
Stocks Live+ Best Stock Market
Developer
Cinnamon Mobile LLC
Bundle ID
Not found
App Store URL
Open in App Store
Category
Finance
Content rating
9+
Languages
EN, FR, DE, IT, JA, KO, PT, ZH, ES

Company

Website
Not found
Tagline
Today
Description
Find apps and games for iPhone, iPad, Mac, and more on the App Store.
Founded
Not found
HQ / Address
Not found
Employees
Not found
Logo
Available

Revenue

Verified revenue / mo
Not found
AI revenue estimate / mo
Not found
AI annual estimate
Not found
ML model estimate / mo
$11.9K/mo
Top-grossing rank
Not found
All-time revenue
Not found
Pricing
Not found

Founder

Founder data not yet collected for this app.

Funding

Funding data not yet collected for this app.

Press & Links

Press & Links data not yet collected for this app.

Contacts & Socials

Contacts & Socials data not yet collected for this app.
📈Ratings growth1,002 ratings+123% lifetimeShow 3-year history estimate ▾Mar 2022Nov 2024Jun 2026
Tracked (32 weeks) Pre-tracking estimate (37 weeks) · model-based, ±5% noise · anchored to release date and current value
🌍Geographic ReachNot ranked
This app is currently outside the top 100 grossing in all 9 countries we monitor (US, UK, DE, FR, JP, CA, AU, BR, IN). Niche or new apps often launch this way — popularity rankings appear once daily revenue clears the regional threshold.
💰Pricing History$0.00 → $9.99 (+0%)
Profile is built from iTunes Lookup + developer site scrape + ML revenue model. Empty fields show "Not found" — additional sources (Crunchbase, X, IndieHackers, Acquire.com) coming.

📝 About this app

- Any broker CSV import**.
- Compare Feature**.
- Stocktwits Integration**.
- The Best Stock Market Apps for iPhone and iPad 2020. Thebalance.com
- Best Stock Market App for iPhone in 2014 - About.com.
- Stock Market App to Boost Your Portfolio - TheStreet.com.
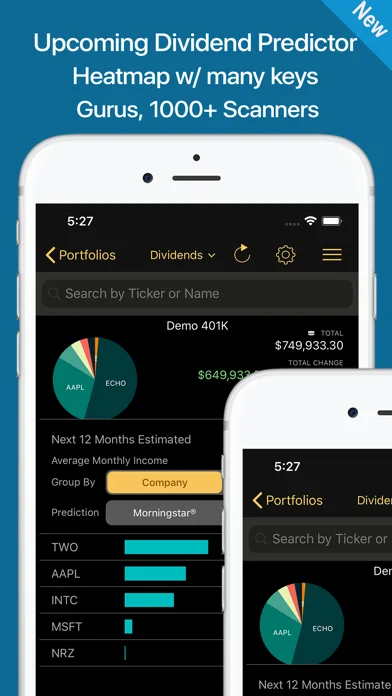
Stocks Live is an amazing way to track the stocks you know and discover new winners. Securely sync and trade your portfolios with major brokers anywhere, anytime.

-- FEATURE HIGHLIGHTS
- Integration with TipRanks SmartScore and price target.
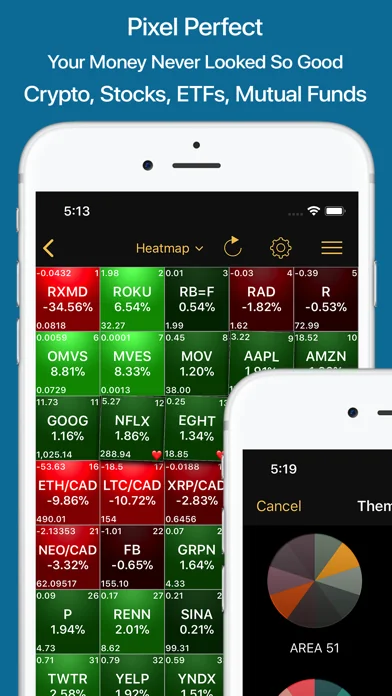
- Unique Heat map visualization, with dancing tiles**… View full description on the official store →
App Specs
🔐 Own this app? Claim & verify MRR →
💾 25 MB🔞 9+📱 iOS 16.6+🔖 v39.8🔄 updated 0d ago🌐 EN, FR, DE, IT, JA +4📂 Finance💰 Paid
📅

What Worked™ · Development Pipeline

12 EVENTS TRACKED
Detected changes in this app over its tracked lifetime — each event links cause (what changed) to effect (what moved). Sorted newest first.See full history →Version history →
2026-05
Rating ↑ 4.20 → 4.58 (improved 0.38★)
2026-05
💲
Went paid — introduced $9.99 price point
2026-03
📈
Crossed 1,000 ratings — social-proof flywheel kicking in
2026-02
📈
Crossed 500 ratings — social-proof flywheel kicking in
2017-05
📈
Crossed 100 ratings — social-proof flywheel kicking in
2016-03
📈
Crossed 50 ratings — social-proof flywheel kicking in
2015-08
📈
Crossed 10 ratings — social-proof flywheel kicking in
2015-06
Rating ↓ 3.40 → 3.00 (dropped 0.40★)
2015-05
Rating ↓ 4.00 → 3.40 (dropped 0.60★)
2015-05
Rating ↑ 3.00 → 3.67 (improved 0.67★)
2015-05
Rating ↑ 1.00 → 3.00 (improved 2.00★)
2015-04
🚀
First tracked snapshot — initial data captured
🔔

Track this app’s revenue

FREE
Get an email when revenue moves by your threshold. No spam, unsubscribe in one click.

📝 Description

95
BU Score · Transcendent
Full revenue analysis
Read the article-style breakdown for Stocks Live+ Best Stock Market: category rank, percentile, growth signal, comparable apps, and how the forecast is calibrated against verified-MRR anchors in this niche.
Read deep-dive →

More by Cinnamon Mobile LLC

View all →
📦 Portfolio summaryINDIE studio
3apps·$40K/mocombined
Lead-app heavy — top app contributes 70%

Similar apps in Finance

About this analysis
ZCAnalyzed by Zakhar Chumak · founder, bumetric·Full methodology·Medium confidence

Why medium confidence: 1,002 ratings · no founder-verified revenue (model estimate only).

Frequently Asked Questions

4 answers · auto-generated from this app's public data
How much does Stocks Live+ Best Stock Market make per month?
Based on our ML-calibrated revenue forecast, Stocks Live+ Best Stock Market earns approximately $11K/mo. This is a US-storefront-equivalent estimate; global revenue can be several times larger for internationally-distributed apps. See the methodology page for the full formula and confidence bands.
What apps are like Stocks Live+ Best Stock Market?
Browse the full Finance category catalog to find similar apps with revenue, build cost, audience and tech stack data. Each /p/{slug} page also shows a Compare side-by-side widget with three peer apps from the same niche.
Who makes Stocks Live+ Best Stock Market?
Stocks Live+ Best Stock Market is published by Cinnamon Mobile LLC on the Apple App Store. See the full publisher portfolio (other apps by the same developer) via the More by developer block on the product page above.
What is Stocks Live+ Best Stock Market's BU Score?
Stocks Live+ Best Stock Market has a BU Score of 67/100 (Solid). The score combines App Store rating, ratings count, monetization model and revenue signals calibrated against founder-verified MRR anchors. See the BU Score formula.