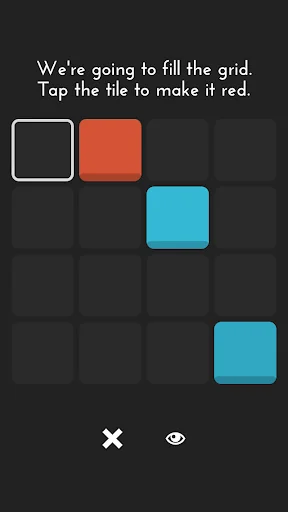
0h h1 is a little logic game that follows three simple rules:
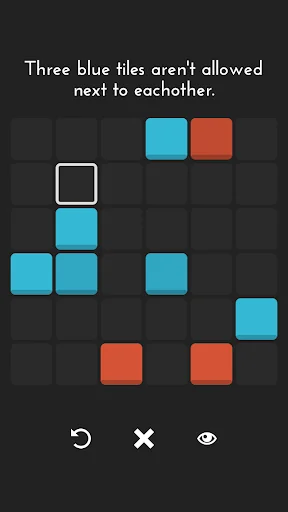
- Three red tiles or three blue tiles next to each other in a row or column isn't allowed
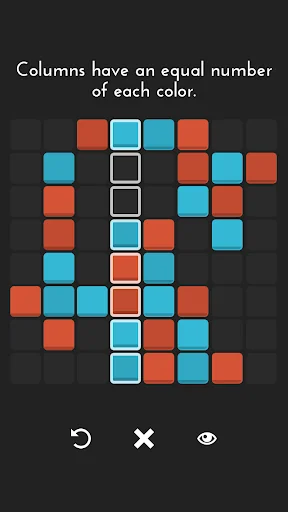
- A full row or column must have as many blue tiles as it has red ones.
- No two rows are the same. No two columns either.
It's up to you to complete the grid without ever having to guess. Simply tap a tile to make it blue or red and complete the grid.
0h h1 is 100% free, without ads or locked content and gives you unlimited puzzles i…
0h h1 is a little logic game that follows three simple rules:
- Three red tiles or three blue tiles next to each other in a row or column isn't allowed
- A full row or column must have as many blue tiles as it has red ones.
- No two rows are the same. No two columns either.
It's up to you to complete the grid without ever having to guess. Simply tap a tile to make it blue or red and complete the grid.
0h h1 is 100% free, without ads or locked content and gives you unlimited puzzles in these grid sizes:
4 x 4
6 x 6
8 x 8
10 x 10
12 x 12
Each puzzle can be played in perfect Zen mode without any pressure. But you can attempt to beat your personal best time in the game's time trials, unlock fun achievements and compete with friends in leaderboards.
0h h1 is akin to Binary Sudoku, also known as Takuzu, Binairo or Binaire.
0h h1 is a little gift to you. I hope you enjoy it.
0h h1 can also be played on 0hh1.com.
And don't forget to check out its sibling game 0h n0! 0hn0.com
Comparable Android apps
The five apps in Puzzle with the closest revenue to 0h h1. Click any to see its detail page.
Each forecast combines App Store rating, ratings count, monetisation model, pricing tier, IAP signals and ad-supported flag.
The base estimate is then multiplied by a per-category scaling factor learned from apps with founder-verified MRR.
Every number on this page comes from public APIs and bumetric's own snapshot history.
Full methodology covers input variables, accuracy bands per category and how we treat apps without comparable anchors.
See also the live data on 0h h1's tracker page for current rating, reviews and snapshot timeline.
Building something similar? Get a free AI audit with $-revenue forecasts for every recommendation.

 Escape Game: Spooky
 Time Machine: Hidden Objects
 Home Of Lost:Escape Room Games
 Magic Match3 - Jewel Quest
 National Park Jigsaw Puzzle