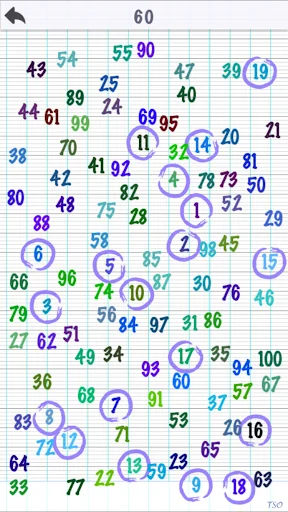
1 To 100 - Funny, interesting, best and simple game on the school. The students write the random position number from 1 to 100 on the paper, and then search by order.
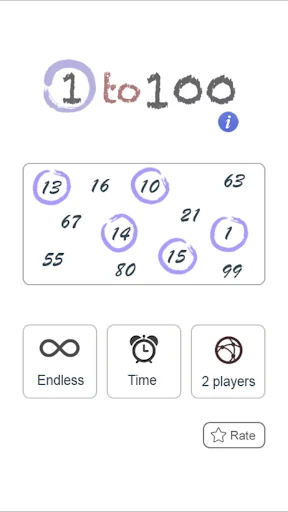
The game is based that ideal. And play with 3 options:
Endless: play 1 to 100 with unlimited time.
Time: play 1 to 100 with 300 seconds.
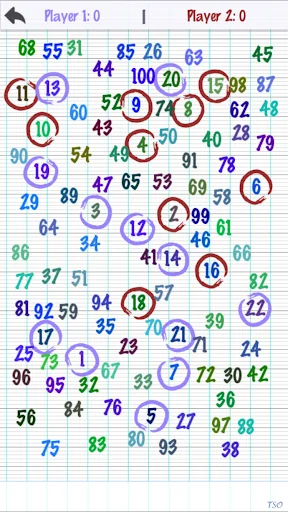
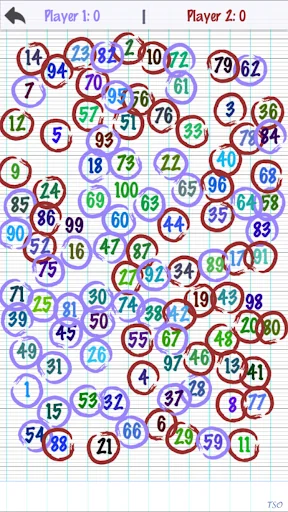
2 players: Matches between 2 players.
Feature:
- HD and nice graphics.
- Share score
- High score
- Fun to play
Find from 1 to 100 to win. 1 to 100, 1 - 100 game, funny game on th…
1 To 100 - Funny, interesting, best and simple game on the school. The students write the random position number from 1 to 100 on the paper, and then search by order.
The game is based that ideal. And play with 3 options:
Endless: play 1 to 100 with unlimited time.
Time: play 1 to 100 with 300 seconds.
2 players: Matches between 2 players.
Feature:
- HD and nice graphics.
- Share score
- High score
- Fun to play
Find from 1 to 100 to win. 1 to 100, 1 - 100 game, funny game on the school.
Comparable Android apps
The five apps in Casual with the closest revenue to 1 To 100. Click any to see its detail page.
Each forecast combines App Store rating, ratings count, monetisation model, pricing tier, IAP signals and ad-supported flag.
The base estimate is then multiplied by a per-category scaling factor learned from apps with founder-verified MRR.
Every number on this page comes from public APIs and Bumetric's own snapshot history.
Full methodology covers input variables, accuracy bands per category and how we treat apps without comparable anchors.
See also the live data on 1 To 100's tracker page for current rating, reviews and snapshot timeline.
Building something similar? Get a free AI audit with $-revenue forecasts for every recommendation.


 Seagull Family: Bird Games
 Digolux
 Bingo Cards
 Royal Princess Wedding Salon
 鬥地主-随时斗地主