Overview
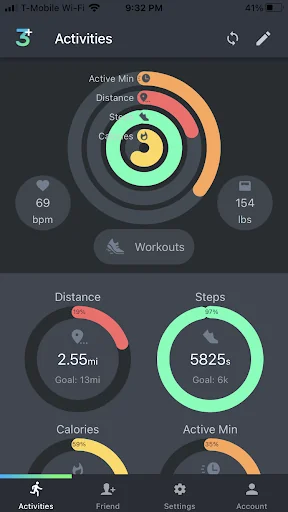
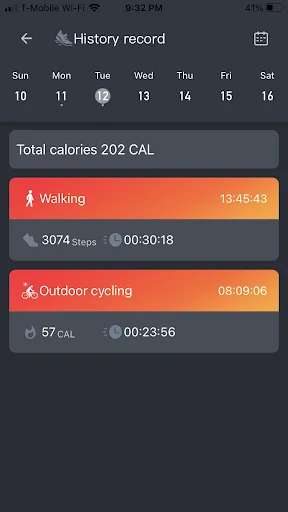
Activity Tracking: Monitor your daily steps taken, distance traveled, calories burned and more.
Personal Goal Setting: Set personal goals on steps, calories, distance, active minutes and sleep.
Stay Motivated: Set custom inactivity alerts to keep yourself moving throughout the day.
Smart Features
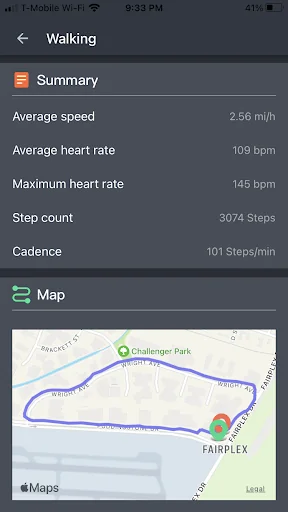
Heart Rate Tracking: Understand your overall heart rate during the day and workout. Track your heart rate pattern for better health condition.
Smart Notifications: Receive and quick repl…
Overview
Activity Tracking: Monitor your daily steps taken, distance traveled, calories burned and more.
Personal Goal Setting: Set personal goals on steps, calories, distance, active minutes and sleep.
Stay Motivated: Set custom inactivity alerts to keep yourself moving throughout the day.
Smart Features
Heart Rate Tracking: Understand your overall heart rate during the day and workout. Track your heart rate pattern for better health condition.
Smart Notifications: Receive and quick reply(Vibe Lite only) notifications from your phone such as SMS, calls(caller ID) and 3rd party Apps. *Please see below Note and permission requirements for details.
Weather Info: Check everyday weather condition and temperature.
Calendar Alert: Set custom reminders on your phone calendar to initiate calendar alert to the watch.
Customizable Watch Face: Select photos from your phone album or select various watch faces from the App.
*NOTE:
3Plus ensures that the information being collected below will not be used for any other purpose other than providing services and maintaining device functionalities.
The APP needs the read_call_log, read SMS and write SMS permissions, and you can dismiss or refuse those permissions at any time. But without those permissions, the features of incoming call notification, SMS notification, and quick reply will not be able to work. The privacy permission is used for device functionality purpose only. 3Plus will never disclose, save, publish or sell your data. 3Plus seriously takes security and protect your personal information.
Access to location data is to ensure that the device can connect to your mobile device to provide accurate data at your location.
Access to photo album, media content, and files are to ensure that the images, videos and other data can be displayed on the App.
Access to workout data is to ensure all activities and workout data can be displayed on the App.
Permissions required for incoming calls, notifications, SMS and etc. :
Access to cell phone call log is to ensure the watch will be able to show incoming calls.
Access to cell phone contacts is to ensure the watch will be able to show the caller ID.
Access to call status is to ensure the watch will be able to show the status of the call.
Comparable Android apps
The five apps in Lifestyle with the closest revenue to 3+ PRO. Click any to see its detail page.
Each forecast combines App Store rating, ratings count, monetisation model, pricing tier, IAP signals and ad-supported flag.
The base estimate is then multiplied by a per-category scaling factor learned from apps with founder-verified MRR.
Every number on this page comes from public APIs and Bumetric's own snapshot history.
Full methodology covers input variables, accuracy bands per category and how we treat apps without comparable anchors.
See also the live data on 3+ PRO's tracker page for current rating, reviews and snapshot timeline.
Building something similar? Get a free AI audit with $-revenue forecasts for every recommendation.


 Homeless Plus
 Blender Camera Blender Collage
 แก้กรรม - Kamma
 Phật Đản
 FROG Water Care®