ML revenue forecast.
Calibrated against 24961 apps in this category.
Confidence band
±15%
High — many comparable apps with verified data
At a glance
Earns 28.13× more than the category median (181/mo).
Ranks #135 of 24,961 in Sports (top 0.5% by revenue).
Launched Jun 07, 2011 · last updated May 08, 2026.
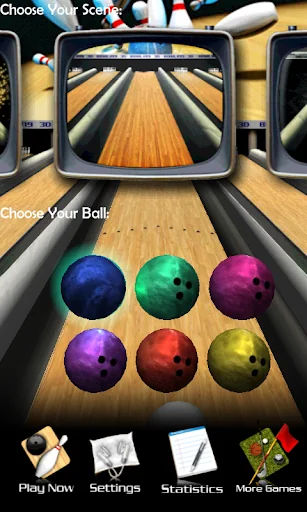
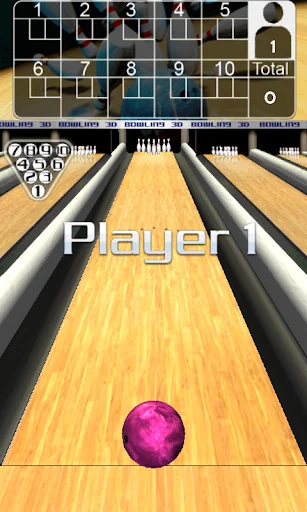
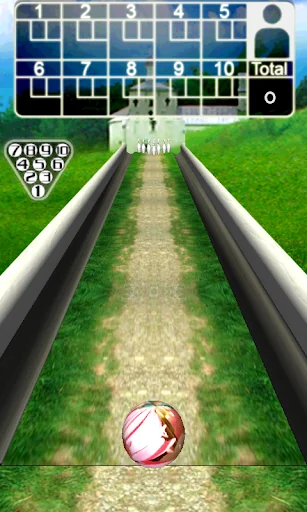
What the app looks like
Live screenshots from the Play Store, captured by our snapshot worker. Tap any image to enlarge.
3D Bowling's revenue trajectory
Forecast revenue from snapshot history. Last 2 months.
Where 3D Bowling sits in Sports
Revenue distribution of 24961 comparable apps. 3D Bowling highlighted.
3D Bowling vs comparable apps
Revenue trajectory side-by-side. Bold = 3D Bowling, ghosted = peers.
App spec
Version
4.3
Last update
May 08, 2026
Launched
Jun 07, 2011
Price
Free
Monetization
Free
What 3D Bowling actually does (from store listing)
This is the best and most realistic 3D bowling game on the Android phones. It is the only bowling game that fully embraces the incredible 3D physics engine and effects.
Be the world's best player in 3D bowling game. How many consecutive strikes can you score?
Game Features:
- Stunning 3D graphics
- State-of-the-art 3D physics engine for real pin action
- 5 outrageous bowling scene
- Multiple bowling balls in each scene
- Detail stats tracking
How to Play:
1. Drag the ball to the l…
This is the best and most realistic 3D bowling game on the Android phones. It is the only bowling game that fully embraces the incredible 3D physics engine and effects.
Be the world's best player in 3D bowling game. How many consecutive strikes can you score?
Game Features:
- Stunning 3D graphics
- State-of-the-art 3D physics engine for real pin action
- 5 outrageous bowling scene
- Multiple bowling balls in each scene
- Detail stats tracking
How to Play:
1. Drag the ball to the left or right to position the ball for your throw
2. Flick the ball with your finger to bowl
3. Gesture a curve the screen to throw a hook ball
Notes: The permissions required in this game is only used for online leader board. Thanks.
Comparable Android apps
The five apps in Sports with the closest revenue to 3D Bowling. Click any to see its detail page.
Each forecast combines App Store rating, ratings count, monetisation model, pricing tier, IAP signals and ad-supported flag.
The base estimate is then multiplied by a per-category scaling factor learned from apps with founder-verified MRR.
Every number on this page comes from public APIs and bumetric's own snapshot history.
Full methodology covers input variables, accuracy bands per category and how we treat apps without comparable anchors.
See also the live data on 3D Bowling's tracker page for current rating, reviews and snapshot timeline.
Building something similar? Get a free AI audit with $-revenue forecasts for every recommendation.


 Peladeiros Pro Soccer Players
 PinPal
 Head Soccer
 Pool Billiards Pro
 Wrestling Revolution 3D