ML revenue forecast.
Calibrated against 48160 apps in this category.
Confidence band
±15%
High — many comparable apps with verified data
At a glance
Earns 3.68× more than the category median (130/mo).
Ranks #2,081 of 48,160 in Business (top 4.3% by revenue).
Launched Oct 31, 2011 · last updated Dec 18, 2018.
What the app looks like
Live screenshots from the Play Store, captured by our snapshot worker. Tap any image to enlarge.
3D Charts's revenue trajectory
Forecast revenue from snapshot history. Last 1 months.
Where 3D Charts sits in Business
Revenue distribution of 48160 comparable apps. 3D Charts highlighted.
3D Charts vs comparable apps
Revenue trajectory side-by-side. Bold = 3D Charts, ghosted = peers.
App spec
Version
6.0
Last update
Dec 18, 2018
Launched
Oct 31, 2011
Price
Free
Monetization
Free
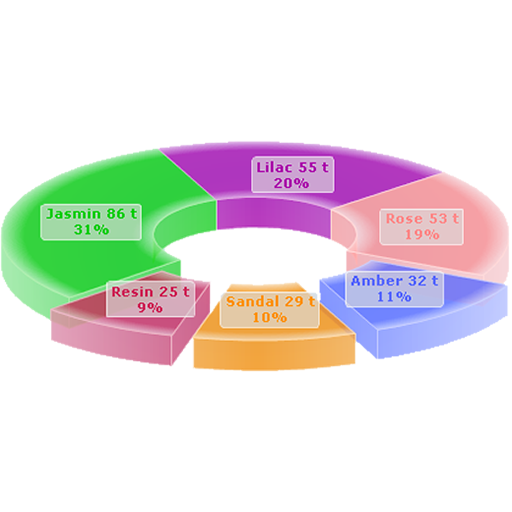
What 3D Charts actually does (from store listing)
Create astonishingly good looking 3D Charts within seconds.
Visualize and share data instantly!
● ● ● ad-free ● ● ●
Get dozens of high end Charting types in 3D and 2D, landscape and portrait:
FREE Percentage Charts:
● Pie
● Doughnut
● Pyramid
● Cone
● Funnel
● staggered Column
● staggered Cylinder
WATERMARKED (yet fully functional) Combination Charts:
● Line
● Area
● Column
● Cylinder
● Surface (colored by series or by height/region)
● Stepline
● floating Area
● float…
WATERMARKED (yet fully functional) Combination Charts:
● Line
● Area
● Column
● Cylinder
● Surface (colored by series or by height/region)
● Stepline
● floating Area
● floating Column (Renko as single series)
● floating Cylinder
● Bubble
FREE Radar and Polar:
● Line
● Area
● Rose
All charts are highly customizable, set your own colors load pictures and logos as background and save the graph as image rendered in 3D to Android's photo gallery. Export your charts as high quality PNG file with transparency (good for graphic designers). Use your own chart photos as attachment or upload. It's great for mobile blogging and for social sites ... boost your data analysis.
This app is the enhancement for your mobile office and journalism and press reporting on the move. It's loaded with features for science development and research. The isometric 3D projection makes data comparison easy and yet it's very eye-catching. 3D Charts is an essential tool you don't want to miss.
Set number prefix like '$ € £ ¥' or suffix like 't' for tonnes. UTF-8 font support. So type Chinese Korean Arabic Hebrew if you like. ÇÖéØ
Scaling (official SI abbreviations) font size bold number precision can be set. 3D-2D aspect ratio and width / height slider.
Yes, the data can be exported to Android's clipboard, copy and paste. All data is automatically saved. 'Save As' project option.
Intuitive User interface. Test play and plug and see for yourselves. To become professional with the 3D Charts app it's highly recommended to read the online user manual thoroughly, go: http://www.advance-media.com/3D_Charts_mobile
Tablets with big screens are welcome!
Wishing fun with mobile 3D charting, be convincing, be successful! Make your statistic count!
Comparable Android apps
The five apps in Business with the closest revenue to 3D Charts. Click any to see its detail page.
Each forecast combines App Store rating, ratings count, monetisation model, pricing tier, IAP signals and ad-supported flag.
The base estimate is then multiplied by a per-category scaling factor learned from apps with founder-verified MRR.
Every number on this page comes from public APIs and bumetric's own snapshot history.
Full methodology covers input variables, accuracy bands per category and how we treat apps without comparable anchors.
See also the live data on 3D Charts's tracker page for current rating, reviews and snapshot timeline.
Building something similar? Get a free AI audit with $-revenue forecasts for every recommendation.


 Direct Energy Account Manager
 ai.keyboard Gold theme
 Prudent Partner Desk
 Towbook
 Timesheets - Time Tracking App