[Detailed function introduction]
【front page】
Let you have the most complete event information at your fingertips. iOPEN Mall, i pre-order and other services allow you to shop on major platforms with just one click; fun games allow you to get more good discounts.
【Latest Offers】
Provide you with the most real-time discounts on events, selected delicacies, carefully selected products, and convenient life.
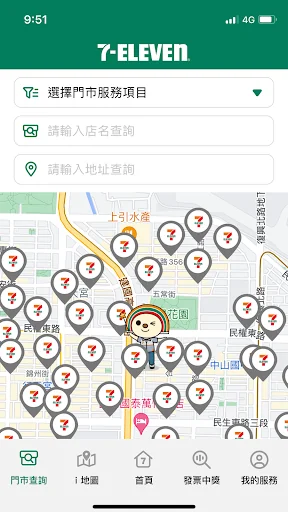
【Store inquiry】
The convenient and fast query interface takes you to the store you wan…
[Detailed function introduction]
【front page】
Let you have the most complete event information at your fingertips. iOPEN Mall, i pre-order and other services allow you to shop on major platforms with just one click; fun games allow you to get more good discounts.
【Latest Offers】
Provide you with the most real-time discounts on events, selected delicacies, carefully selected products, and convenient life.
【Store inquiry】
The convenient and fast query interface takes you to the store you want to go to.
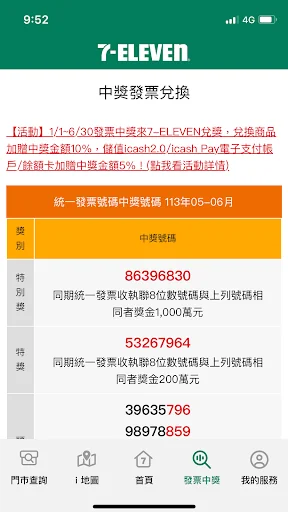
【My good health】
In addition to irregular collection discount announcements, all tickets obtained from the amusement park are here. Remember to collect them before the redemption date~
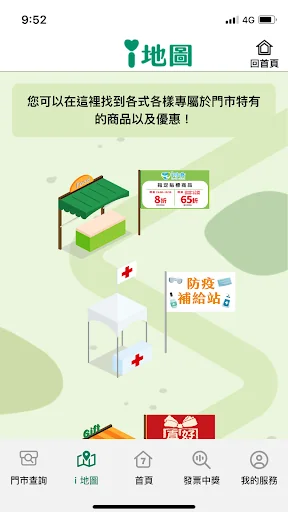
【More services】
Quickly connect to OPENPOINT, food delivery, 7-ELEVEN LINE official account, 7-ELEVEN official fan club, 7-ELEVEN official YOUTUBE, mobile wallet, and unified invoice inquiries all here!
Comparable Android apps
The five apps in Lifestyle with the closest revenue to 7-ELEVEN. Click any to see its detail page.
Each forecast combines App Store rating, ratings count, monetisation model, pricing tier, IAP signals and ad-supported flag.
The base estimate is then multiplied by a per-category scaling factor learned from apps with founder-verified MRR.
Every number on this page comes from public APIs and bumetric's own snapshot history.
Full methodology covers input variables, accuracy bands per category and how we treat apps without comparable anchors.
See also the live data on 7-ELEVEN's tracker page for current rating, reviews and snapshot timeline.
Building something similar? Get a free AI audit with $-revenue forecasts for every recommendation.

 Angel Energy Cards
 GoLocator: Family Location Fin
 Aktif Solat
 CPlus Classifieds
 Candy simply-Fi