Live screenshots from the Play Store, captured by our snapshot worker. Tap any image to enlarge.
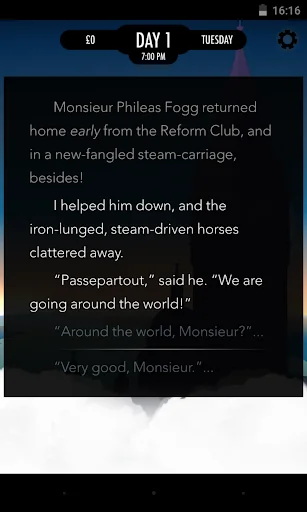
1872, with a steampunk twist. Phileas Fogg has wagered he can circumnavigate the world in just eighty days.
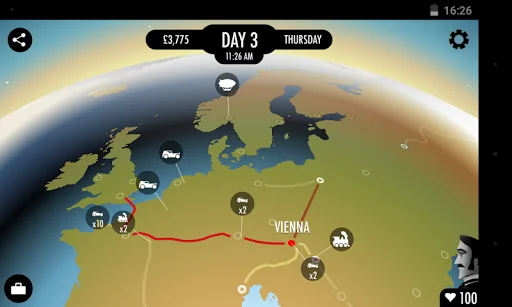
Choose your own route around a 3D globe, travelling by airship, submarine, mechanical camel, steam-train and more, racing other players and a clock that never stops in TIME Magazine's #1 Game of the Year 2014.
Featuring stunning art by Jaume Illustration, a half-million word script by Meg Jayanth, original music by Laurence Chapman, and built using the same inklewriter engine that p…
Read full description →
1872, with a steampunk twist. Phileas Fogg has wagered he can circumnavigate the world in just eighty days.
Choose your own route around a 3D globe, travelling by airship, submarine, mechanical camel, steam-train and more, racing other players and a clock that never stops in TIME Magazine's #1 Game of the Year 2014.
Featuring stunning art by Jaume Illustration, a half-million word script by Meg Jayanth, original music by Laurence Chapman, and built using the same inklewriter engine that powers our critically-acclaimed Sorcery! series, 80 DAYS is an interactive adventure created by your choices, on the fly, and is different every time you play.
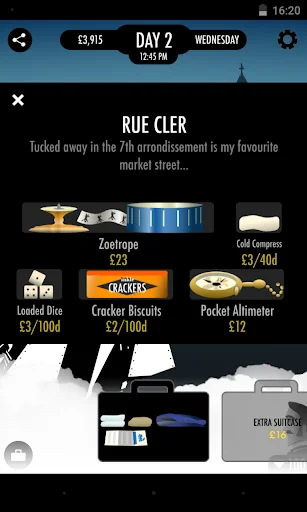
Playing as Phileas Fogg's loyal valet, Passepartout, you must balance your master's health, your finances, and the time, as you choose your own path from city to city all the way around the world. Bribe your way onto early departures, but don't let yourself go bankrupt or you'll be sleeping rough and begging for aid! Trade items for profit, and collect the equipment for the conditions you'll face: but too much luggage will slow you down...
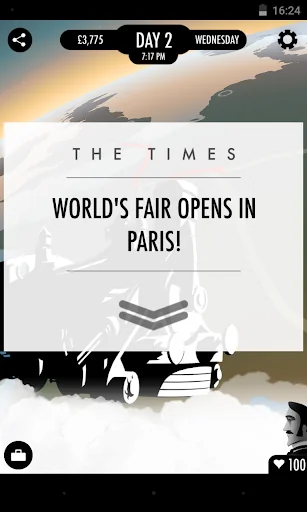
80 DAYS is a breakneck race, with an in-game clock that never stops running. Trains, steamers, hot-air balloons, boats, camels, horses and more leave and arrive minute by minute.
Every city and journey is narrated via an interactive story where you control every action. Will your choices speed you up - or lead you into disaster? Will you earn Fogg's trust and respect? Will you uncover the secrets and short-cuts that can shave days off your time? Murder, romance, rebellion and intrigue await!
The app is network-connected, with a live feed that shows you the position of all the other players of the game, their routes, triumphs and disasters. You can race to be the fastest - or look ahead to learn the secrets of the world.
Share your own journey with friends, and load other's routes directly into your app so you can race head-to-head.
* "We’ve been dreaming about this future for decades. Guess what? It’s here." - New York Times
* "This brilliant interactive novel re-imagines Phileas Fogg's journey around the world... One of the finest examples of branching narrative yet created." - The Telegraph
* "For people who love high adventures and good writing, 80 Days is a voyage that must be taken" - The Verge
* "A brilliantly paced, memorable and quite frankly terrific piece of modern interactive fiction, that masterfully blends strategy, resource management and adventure" - IndieGames.com
* "This is modern storytelling that engages and delights, and the bold, stylish artwork gives 80 Days almost a graphic novel feel. Pack your case, armchair Passepartout - adventure awaits!" - Joystiq
150 cities to explore. Millions of journeys. Detailed research and techno-fantasy combine in an 1872 of tensions, inventions and exploration. Climb the Burmese mountains, trek the Zulu Federation, sail up the Amazon and disappear under the Indian Ocean - but don't fall behind the time!
The five apps in Role Playing with the closest revenue to 80 Days. Click any to see its detail page.
Each forecast combines App Store rating, ratings count, monetisation model, pricing tier, IAP signals and ad-supported flag.
The base estimate is then multiplied by a per-category scaling factor learned from apps with founder-verified MRR.
Every number on this page comes from public APIs and bumetric's own snapshot history.

 DRAGON QUEST VIII
 Goat Simulator MMO Simulator
 Baldur's Gate II: Enhanced Ed.
 Cat Quest
 FINAL FANTASY DIMENSIONS