QUALITY FOOD. UNIQUE ATMOSPHERE. GOOD COMPANY.
801 CHOPHOUSE is the flagship concept of 801 Restaurant Group with eight locations, serving only USDA PRIME beef and jet fresh fish, paired with a Wine Spectator awarded wine list. Whether you are looking for an intimate meal for two or a place to hold your next event, 801 Chophouse provides the best steakhouse restaurant experience in Des Moines, St. Louis, Leawood, Kansas City, Omaha, Denver, Minneapolis and Washington D.C.
801 FISH, founded i…
QUALITY FOOD. UNIQUE ATMOSPHERE. GOOD COMPANY.
801 CHOPHOUSE is the flagship concept of 801 Restaurant Group with eight locations, serving only USDA PRIME beef and jet fresh fish, paired with a Wine Spectator awarded wine list. Whether you are looking for an intimate meal for two or a place to hold your next event, 801 Chophouse provides the best steakhouse restaurant experience in Des Moines, St. Louis, Leawood, Kansas City, Omaha, Denver, Minneapolis and Washington D.C.
801 FISH, founded in 2013, offers diners globally sourced pristine FINNED FISH & CRUSTACEANS with an award-winning wine list in a lively and sophisticated atmosphere. Enjoy the best seafood in St. Louis, Denver and Minneapolis at 801 Fish.
801 LOCAL, located in St. Louis, is a neighborhood establishment that carries a classy, comfortable and personable ambiance. The menu is eclectic and upscale, featuring seasonal, hand-crafted american cuisine. Our guests can call 801 Local their own with pride.
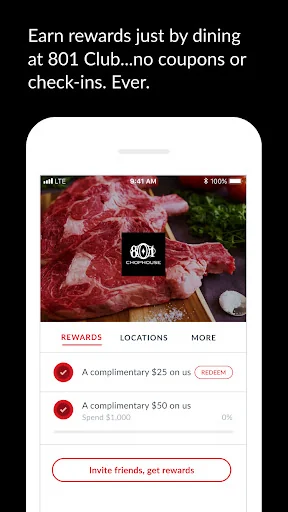
Download our app to get $25 after your first purchase and extra perks. Here’s how it works:
1) Register your credit/debit card(s) in the app.
2) Shop as usual.
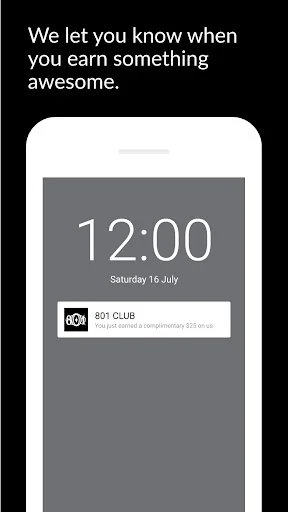
3) We’ll buzz your phone when you earn a reward. No need to fish your phone out, check-in, or scan anything. Just pay as usual.
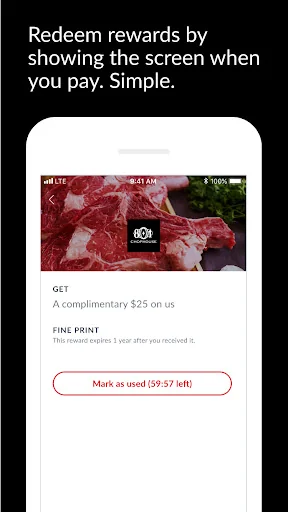
4) Rewards show up on your phone for you to use. It's like magic!
Comparable Android apps
The five apps in Food & Drink with the closest revenue to 801 PRIME. Click any to see its detail page.
Each forecast combines App Store rating, ratings count, monetisation model, pricing tier, IAP signals and ad-supported flag.
The base estimate is then multiplied by a per-category scaling factor learned from apps with founder-verified MRR.
Every number on this page comes from public APIs and bumetric's own snapshot history.
Full methodology covers input variables, accuracy bands per category and how we treat apps without comparable anchors.
See also the live data on 801 PRIME's tracker page for current rating, reviews and snapshot timeline.
Building something similar? Get a free AI audit with $-revenue forecasts for every recommendation.

 Oahu Mexican Grill (OMG)
 LosEsquimos
 Eatiko Vendor
 CAFEIN
 Rezepte: RESIPIS