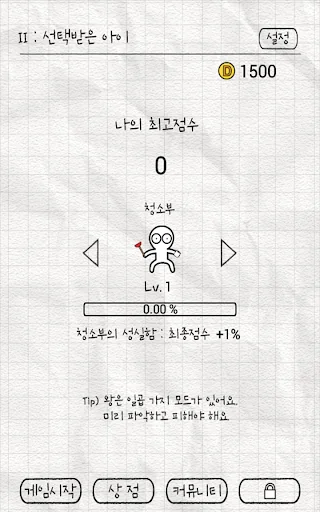
1.2M Assets Tracked Updated 4 min ago Revenue Forecasts
Add an app Create Account Sign In
Home
똥왕의 분노 icon

How much does 똥왕의 분노 earn?

Android app from Nfly · Arcade

ML forecast ★ 4.8 · 14K Free

~1.3K/mo

ML revenue forecast. Calibrated against 27694 apps in this category.

Confidence band
±15%
High — many comparable apps with verified data

At a glance

What the app looks like

Live screenshots from the Play Store, captured by our snapshot worker. Tap any image to enlarge.

똥왕의 분노 screenshot 1 똥왕의 분노 screenshot 2 똥왕의 분노 screenshot 3 똥왕의 분노 screenshot 4

똥왕의 분노's revenue trajectory

Forecast revenue from snapshot history. Last 1 months.

Where 똥왕의 분노 sits in Arcade

Revenue distribution of 27694 comparable apps. 똥왕의 분노 highlighted.

똥왕의 분노 vs comparable apps

Revenue trajectory side-by-side. Bold = 똥왕의 분노, ghosted = peers.

App spec

Version
2.2.2
Last update
Sep 18, 2025
Launched
Jun 08, 2013
Price
Free
Monetization
Free

What 똥왕의 분노 actually does (from store listing)

[game introduction] As a game of avoiding the shit that 100 million users have chosen, It is a game based on a realistic and solid story. 
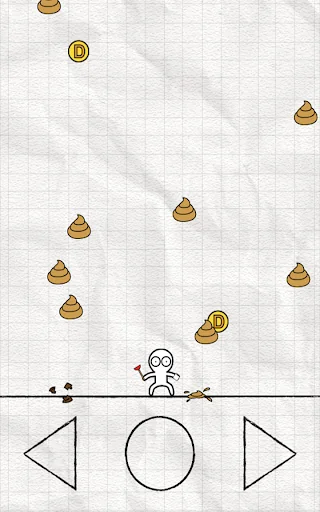
The game method is to avoid the shit that falls from the sky. If you play when you see the ball, You can see the joy is doubled. Long story is not necessary. Let's get started right away. Who is the best? [Game operation] Touch the screen left and right! Touch the center to use the item!
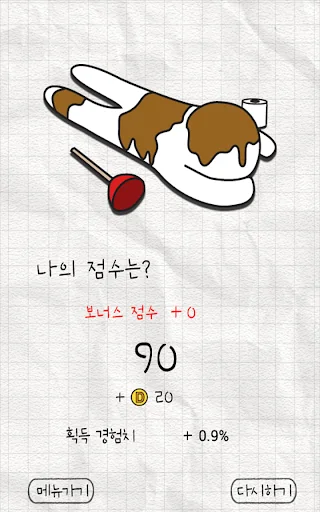
 [Precautions] Please be careful when eating rice ^…
Read full description →

Comparable Android apps

The five apps in Arcade with the closest revenue to 똥왕의 분노. Click any to see its detail page.

AppRevenueRatingRatings
Magnetic Balls: Neon icon Magnetic Balls: Neon 1.3K ★ 4.5 20K
Jump Ball Quest icon Jump Ball Quest 1.3K ★ 4.2 21K
Game Creator Demo icon Game Creator Demo 1.3K ★ 3.6 26K
BanCa Fishing: hunt fish game icon BanCa Fishing: hunt fish game 1.3K ★ 4.6 19K
Galaxy Attack: Chicken Shooter icon Galaxy Attack: Chicken Shooter 1.3K ★ 4.6 19K
Own 똥왕의 분노? Replace our estimate with your real revenue via Stripe Connect or ASC. Get a public Verified badge.
Claim & verify →

How we calculated this

Each forecast combines App Store rating, ratings count, monetisation model, pricing tier, IAP signals and ad-supported flag. The base estimate is then multiplied by a per-category scaling factor learned from apps with founder-verified MRR. Every number on this page comes from public APIs and bumetric's own snapshot history.

Full methodology covers input variables, accuracy bands per category and how we treat apps without comparable anchors. See also the live data on 똥왕의 분노's tracker page for current rating, reviews and snapshot timeline.

Building something similar? Get a free AI audit with $-revenue forecasts for every recommendation.
Audit my app →