No.1 app for pachinko hall companies!
Only the Maruhan app allows you to view Maruhan table data completely free of charge!
For pachinko and pachislot fans who can obtain information on the machines installed at Maruhan and the latest store information.
Useful app.
[Must see! Added new features to enjoy pachinko/pachislot! ]
1. You can view ranking information for all Maruhan stores!
*Due to regulations, store names may not be displayed.
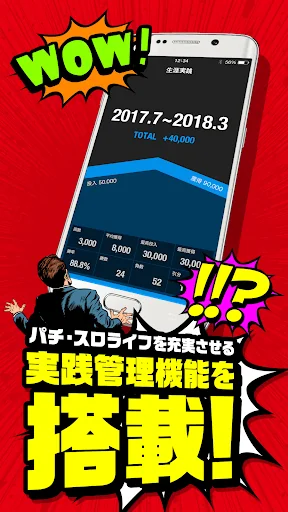
2. Equipped with practical management fun…
Only the Maruhan app allows you to view Maruhan table data completely free of charge!
For pachinko and pachislot fans who can obtain information on the machines installed at Maruhan and the latest store information.
Useful app.
[Must see! Added new features to enjoy pachinko/pachislot! ]
1. You can view ranking information for all Maruhan stores!
*Due to regulations, store names may not be displayed.
2. Equipped with practical management function!
Calendar management function, various practical analysis, and lifelong practice can be understood at a glance!
Save the results of each game in the app. Analyze your own gaming trends!
*To use the practice management function, you will need to register as a Maruhan member.
[Especially recommended for these people! ]
・People who want to know information about Maruhan stores they often visit
・Those who want to check the platform data in advance and decide on the target platform
・Those who want to know the results of the machine they played today
・Those who want to analyze weekly trends of frequently used machines
・People who want to check model information because they don't know how to hit while playing a game
[Maruhan app details]
1. Installed at Maruhan: Approximately 200,000 pachinko and pachislot machines
Data can be viewed for free!
2. Get replacement information and business information for your favorite stores!
You can search for Maruhan nationwide and register your own hall.
Sales information such as replacement of new machines at stores registered as My Hall
Installed models, store locations, etc. can be viewed in an easy-to-understand manner.
Additionally, you can receive business information from your favorite stores via push notifications.
3. Learn how to play all current pachinko and pachislot machines!
It works in conjunction with the Pachi Gabu Guide Station, allowing you to use a new machine or a machine you have never played before.
It is possible to view information on how to play.
[This is the biggest point! ]
・You can see 7 days of Maruhandai data completely free of charge.
Only Maruhan app!
[Supported OS version]
8 or above recommended
Comparable Android apps
The five apps in Entertainment with the closest revenue to マルハンアプリ. Click any to see its detail page.
Each forecast combines App Store rating, ratings count, monetisation model, pricing tier, IAP signals and ad-supported flag.
The base estimate is then multiplied by a per-category scaling factor learned from apps with founder-verified MRR.
Every number on this page comes from public APIs and bumetric's own snapshot history.
Full methodology covers input variables, accuracy bands per category and how we treat apps without comparable anchors.
See also the live data on マルハンアプリ's tracker page for current rating, reviews and snapshot timeline.
Building something similar? Get a free AI audit with $-revenue forecasts for every recommendation.


 Cinema Qatar
 Mini vMac
 Optimum TV
 Meme Maker & Creator by Memeto
 LEGOLAND® Windsor Resort