What Action Driver actually does (from store listing)
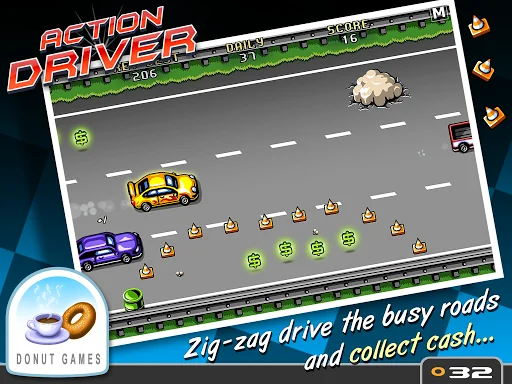
Take a spin on the chaotic roads in ACTION DRIVER for a real thrill ride.
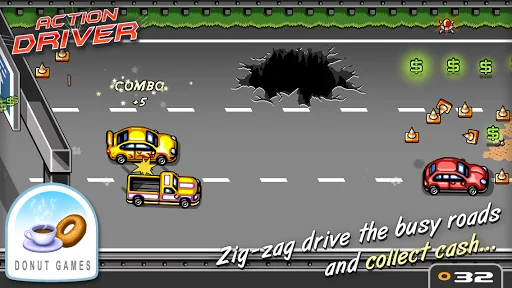
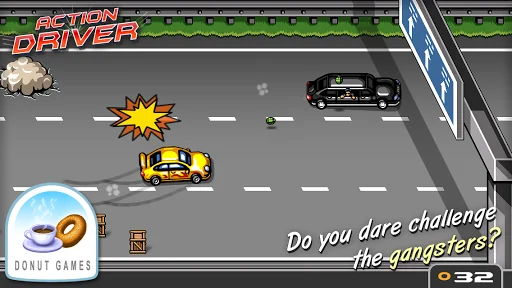
Collect cash, battle grenade-dropping gangsters in limos, and ZIG-ZAG DRIVE the busy roads.
Just in it for the speed?
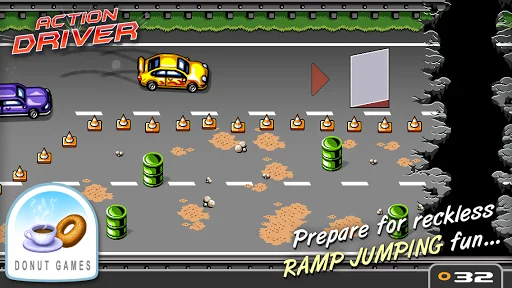
Then put the pedal to the metal and prepare for some reckless RAMP JUMPING fun!
* * * * * * * * * * * * * * * * * * * * * * * *
GAME FEATURES:
- 2 touch control options: Swipe and on-screen DPAD
- Also supports JOY PADS that use Android OS friendly key codes (e.g. KEYCODE_DPAD_UP, KEYCO…
Take a spin on the chaotic roads in ACTION DRIVER for a real thrill ride.
Collect cash, battle grenade-dropping gangsters in limos, and ZIG-ZAG DRIVE the busy roads.
Just in it for the speed?
Then put the pedal to the metal and prepare for some reckless RAMP JUMPING fun!
* * * * * * * * * * * * * * * * * * * * * * * *
GAME FEATURES:
- 2 touch control options: Swipe and on-screen DPAD
- Also supports JOY PADS that use Android OS friendly key codes (e.g. KEYCODE_DPAD_UP, KEYCODE_BUTTON_A)
- Lots of Achievements to unlock: Can you win the "Cargo Snatcher", "Cone Wrecker" and "Mafia Terminator" achievements?
- Randomized streets: The variation never ends
- Traffic cones: You'd NEVER guess how fun they are to run over
- Collectors Icon #32
- And much more...
* * * * * * * * * * * * * * * * * * * * * * * *
* Action Driver is free from ads and playable at no cost, but with a time restriction.
A premium upgrade is provided as an optional one-time in-app purchase, to add unlimited playtime.
We believe in a fair pricing policy: Pay once, own forever!
Enjoy another Donut Games release!
Comparable Android apps
The five apps in Arcade with the closest revenue to Action Driver. Click any to see its detail page.
Each forecast combines App Store rating, ratings count, monetisation model, pricing tier, IAP signals and ad-supported flag.
The base estimate is then multiplied by a per-category scaling factor learned from apps with founder-verified MRR.
Every number on this page comes from public APIs and bumetric's own snapshot history.
Full methodology covers input variables, accuracy bands per category and how we treat apps without comparable anchors.
See also the live data on Action Driver's tracker page for current rating, reviews and snapshot timeline.
Building something similar? Get a free AI audit with $-revenue forecasts for every recommendation.
 Bubble - Mini Games
 Ramp Bike Jumping
 Hitty Knife
 웜볼: 소행성 키우기
 Fishbowl Racer