Welcome to a better way to manage your account with our customer mobile app. You can view and pay your bill, report an outage, check outage status, manage your accounts, view billing history, and more! Use the "Remember me" feature to make login a breeze. Everything is now at the touch of your fingertips.
Features include:
OUTAGE INFORMATION
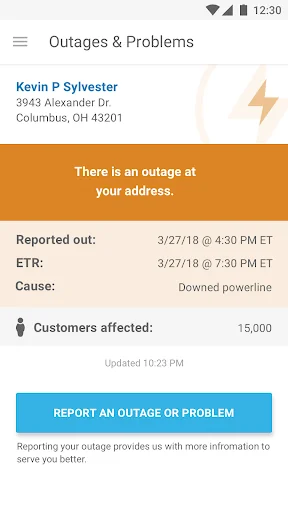
- Report a power outage
- Check outage status and track restoration progress
ACCOUNT MANAGEMENT
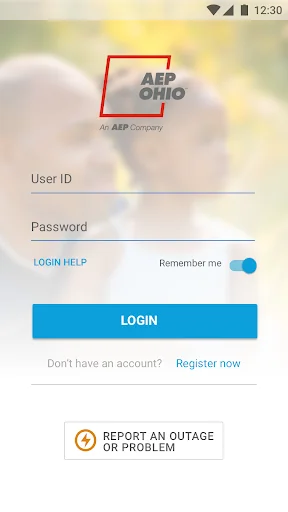
- Choose "Remember me" to skip logging in each t…
Welcome to a better way to manage your account with our customer mobile app. You can view and pay your bill, report an outage, check outage status, manage your accounts, view billing history, and more! Use the "Remember me" feature to make login a breeze. Everything is now at the touch of your fingertips.
Features include:
OUTAGE INFORMATION
- Report a power outage
- Check outage status and track restoration progress
ACCOUNT MANAGEMENT
- Choose "Remember me" to skip logging in each time you use the app*
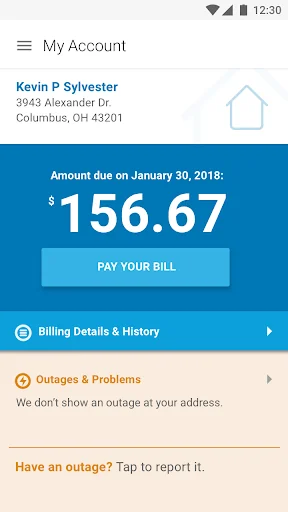
- View your real-time account balance, payment due date, and balance details
- View and download your bill (PDF)
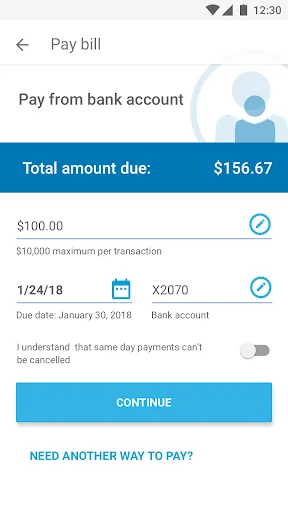
- Pay immediately for free from your bank account
- Make automatic or scheduled payments
- Other ways to pay (credit/debit card, in-person, by phone)
- Switch between multiple accounts
ENERGY USAGE
- Compare how your current usage compares to last month or the same time last year
SETTINGS
- Enroll in and manage your paperless billing
- Add or delete your bank accounts
*Logging into the AEP Ohio app requires an active account that is registered online at AEPOhio.com
Comparable Android apps
The five apps in Business with the closest revenue to AEP Ohio. Click any to see its detail page.
Each forecast combines App Store rating, ratings count, monetisation model, pricing tier, IAP signals and ad-supported flag.
The base estimate is then multiplied by a per-category scaling factor learned from apps with founder-verified MRR.
Every number on this page comes from public APIs and bumetric's own snapshot history.
Full methodology covers input variables, accuracy bands per category and how we treat apps without comparable anchors.
See also the live data on AEP Ohio's tracker page for current rating, reviews and snapshot timeline.
Building something similar? Get a free AI audit with $-revenue forecasts for every recommendation.

 Compass Xoxo
 요기요 사장님
 Housing Finance Bank Uganda
 DCI Mobile EVV
 CRECI
CRECI