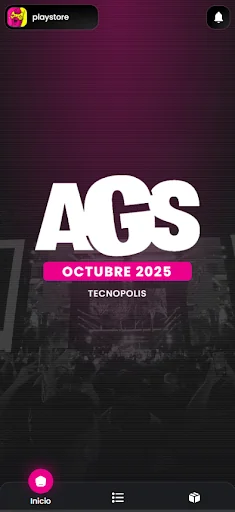
AGS, established as the most important video game and technology festival in the country, returns on October 10, 11 and 12, 2025 at Tecnópolis. With massive attendance and international projection, it brings together the most recognized companies in the field along with developers, prominent figures, fans and professionals from all over the world. With activities for the whole family, in this tenth edition of AGS you will be able to access exclusive launches, numerous exhibitors, Esports competi…
AGS, established as the most important video game and technology festival in the country, returns on October 10, 11 and 12, 2025 at Tecnópolis. With massive attendance and international projection, it brings together the most recognized companies in the field along with developers, prominent figures, fans and professionals from all over the world. With activities for the whole family, in this tenth edition of AGS you will be able to access exclusive launches, numerous exhibitors, Esports competitions, cosplay contests, live shows, talks and workshops, space for the national Industry, special guests and much more.
Comparable Android apps
The five apps in Events with the closest revenue to AGS. Click any to see its detail page.
Each forecast combines App Store rating, ratings count, monetisation model, pricing tier, IAP signals and ad-supported flag.
The base estimate is then multiplied by a per-category scaling factor learned from apps with founder-verified MRR.
Every number on this page comes from public APIs and Bumetric's own snapshot history.
Full methodology covers input variables, accuracy bands per category and how we treat apps without comparable anchors.
See also the live data on AGS's tracker page for current rating, reviews and snapshot timeline.
Building something similar? Get a free AI audit with $-revenue forecasts for every recommendation.



 Cineplace Ticket
 Bay Konser
 Soy Córdoba
 夏凱納靈糧堂(士林靈糧堂)
 DU Unify