Android app
from AIR BUSAN Co., Ltd
· Travel & Local
ML forecast★ 1.4 · 3KFree
~585/mo
ML revenue forecast.
Calibrated against 30046 apps in this category.
Confidence band
±15%
High — many comparable apps with verified data
At a glance
Earns 3.76× more than the category median (155/mo).
Ranks #1,769 of 30,046 in Travel & Local (top 5.9% by revenue).
Launched May 06, 2026 · last updated Mar 31, 2026.
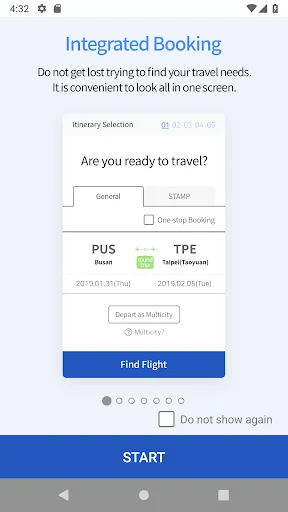
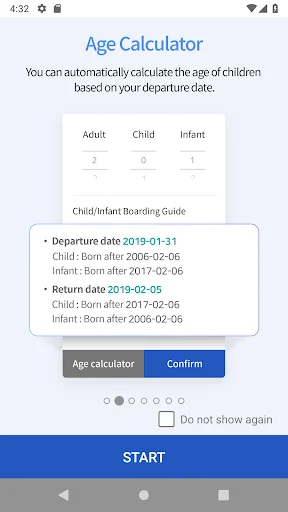
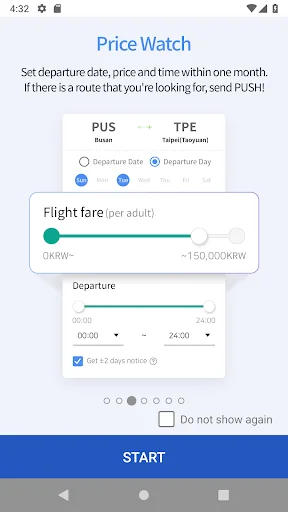
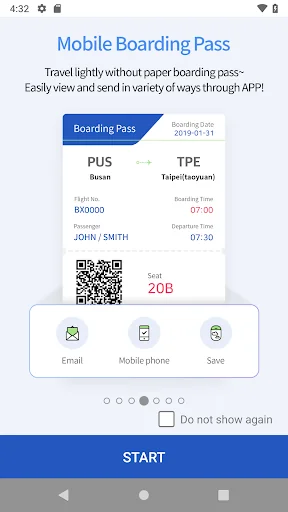
What the app looks like
Live screenshots from the Play Store, captured by our snapshot worker. Tap any image to enlarge.
AIR BUSAN's revenue trajectory
Forecast revenue from snapshot history. Last 1 months.
Where AIR BUSAN sits in Travel & Local
Revenue distribution of 30046 comparable apps. AIR BUSAN highlighted.
AIR BUSAN vs comparable apps
Revenue trajectory side-by-side. Bold = AIR BUSAN, ghosted = peers.
App spec
Version
2.4.16
Last update
Mar 31, 2026
Launched
May 06, 2026
Price
Free
Monetization
Free
What AIR BUSAN actually does (from store listing)
A whole new AIR BUSAN in my hand! Experience our new UI & UX, booking process, mobile check-in and many more new functions all in one application! Plan and manage your trip much easier way!
[ Mobile exclusive services ]
- Support biometric recognition: fingerprints.
- Price Watch: Receive PUSH notification when the conditions (destination, date, price, time) are fit.
- Mobile boarding pass: Can save the boarding pass in application and airplane mode.
- Airplane mode contents: Mobile board…
A whole new AIR BUSAN in my hand! Experience our new UI & UX, booking process, mobile check-in and many more new functions all in one application! Plan and manage your trip much easier way!
[ Mobile exclusive services ]
- Support biometric recognition: fingerprints.
- Price Watch: Receive PUSH notification when the conditions (destination, date, price, time) are fit.
- Mobile boarding pass: Can save the boarding pass in application and airplane mode.
- Airplane mode contents: Mobile boarding pass / Airport & counter information, FLY&FUN, Immigration form, Basic in-flight service)
- Attendance check: Do the attendance and earn STAMPs
- PUSH: Provide various promotions, preferred routes, additional services
[ Key services and features ]
- SNS login: Kakao / Naver (Only available in Korean) / Google / Line (Available other than Korean)
- Domestic/International booking integration: Providing integrated UI on booking process.
- Child/Infant age calculator: Automatically calculates age to identify child/infant.
- Favorite Passenger: Manage passenger’s basic and passport information.
- New simple payment methods: Support Naver Pay and WeChat Pay.
- Check-in: Check-in domestic & international flights and issue boarding pass.
- AIR LOG: View boarding records (DOM & INT’L) and manage your history with timeline function!
※ AIR BUSAN Reservation Center: (82) 1666-3060
Comparable Android apps
The five apps in Travel & Local with the closest revenue to AIR BUSAN. Click any to see its detail page.
Each forecast combines App Store rating, ratings count, monetisation model, pricing tier, IAP signals and ad-supported flag.
The base estimate is then multiplied by a per-category scaling factor learned from apps with founder-verified MRR.
Every number on this page comes from public APIs and bumetric's own snapshot history.
Full methodology covers input variables, accuracy bands per category and how we treat apps without comparable anchors.
See also the live data on AIR BUSAN's tracker page for current rating, reviews and snapshot timeline.
Building something similar? Get a free AI audit with $-revenue forecasts for every recommendation.

 SMS Parking
 Timey: Bus & Train Timetables
 Network Travels
 Ocean Park Hong Kong
 Air Astana