ML revenue forecast.
Calibrated against 27694 apps in this category.
Confidence band
±15%
High — many comparable apps with verified data
At a glance
Earns 2.1× more than the category median (149/mo).
Ranks #4,431 of 27,694 in Arcade (top 16.0% by revenue).
Launched May 23, 2013 · last updated Jan 28, 2014.
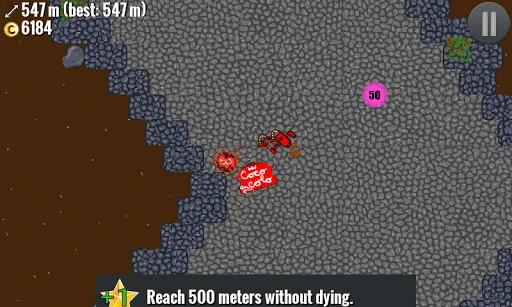
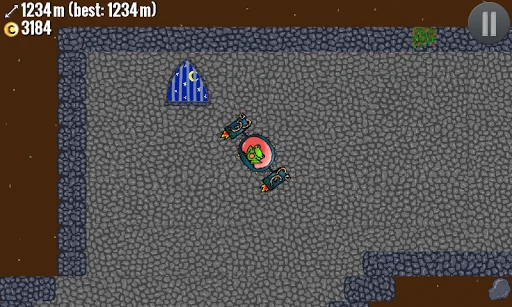
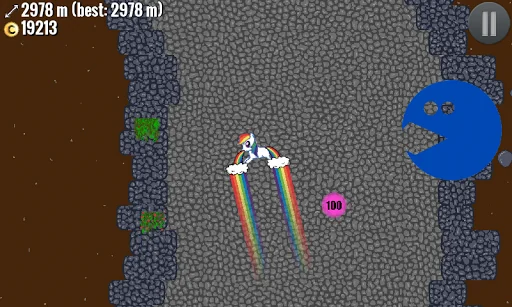
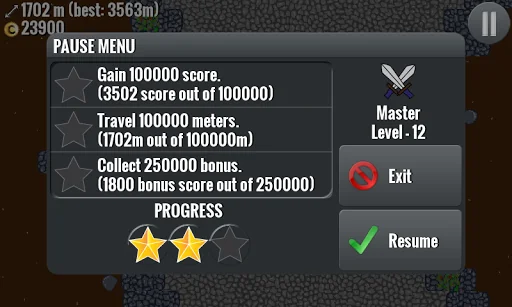
What the app looks like
Live screenshots from the Play Store, captured by our snapshot worker. Tap any image to enlarge.
Air Dance's revenue trajectory
Forecast revenue from snapshot history. Last 1 months.
Where Air Dance sits in Arcade
Revenue distribution of 27694 comparable apps. Air Dance highlighted.
Air Dance vs comparable apps
Revenue trajectory side-by-side. Bold = Air Dance, ghosted = peers.
App spec
Version
1.2.8
Last update
Jan 28, 2014
Launched
May 23, 2013
Price
Free
Monetization
Free
What Air Dance actually does (from store listing)
Oh no! You got lost in the deepest dungeon ever created. Felt asleep while driving and sunk down to the rock bottom. Well there is only one thing you can do, escape that dark place! But soon you’ll realize that this terrible man-made cave is much deeper than you thought…
But no worries! Even when you are deep underground, somehow, you get rewarded for every meter you travel plus you’ll find plenty of bonus money on the way. With this currency you can upgrade your flying machine and make it lo…
Oh no! You got lost in the deepest dungeon ever created. Felt asleep while driving and sunk down to the rock bottom. Well there is only one thing you can do, escape that dark place! But soon you’ll realize that this terrible man-made cave is much deeper than you thought…
But no worries! Even when you are deep underground, somehow, you get rewarded for every meter you travel plus you’ll find plenty of bonus money on the way. With this currency you can upgrade your flying machine and make it look polished and fast once again. Bored of looking at the same skin all the time? Replace your machine completely for something new. You can travel with Coco Colo Machine, Mr. Frog, Mutated Fish or even Rainbow Pony! It also needs to be mentioned, your machine always has two rotors which are controlled by your fingers. Press on the left part of the screen and left rotor will fire, and guess what? Same logic applies for the right part. Press both and you will fly upwards, otherwise you’ll just rotate. Sounds easy, right? Try it!
Features list:
- Choose one out of 5 skins, each one of them is different
- Upgrade your flying machine (maximum speed, rotation speed, controllability)
- Randomly generated dungeon level with 4 different types of chunks (walls on left and right, fork, horizontal and one with moving obstacles)
- Optimized for all screen sizes; you have the choice to lower graphical requirements or pre-generate level (pre-generation is on by default, possible to make it generate in real-time with settings)
- Leveling system! Complete missions to get rewarded with coins and levels
- NEW: Google Play Game Services implemented. Sign in with your Google+ account for leaderboards and achievements
Please report ANY bugs to the developer email linked below. Thanks!
Comparable Android apps
The five apps in Arcade with the closest revenue to Air Dance. Click any to see its detail page.
Each forecast combines App Store rating, ratings count, monetisation model, pricing tier, IAP signals and ad-supported flag.
The base estimate is then multiplied by a per-category scaling factor learned from apps with founder-verified MRR.
Every number on this page comes from public APIs and bumetric's own snapshot history.
Full methodology covers input variables, accuracy bands per category and how we treat apps without comparable anchors.
See also the live data on Air Dance's tracker page for current rating, reviews and snapshot timeline.
Building something similar? Get a free AI audit with $-revenue forecasts for every recommendation.
 Angry Rex
 Mob Control
 Bad-Toys
 Peece Maker
 Root Beer Tapper