What Air Quality Index actually does (from store listing)
Stay informed and breathe better with real-time Air Quality Index (AQI) and weather data from around the world. Track air pollution, monitor key pollutants, and view accurate weather updates to make smarter health and travel decisions.
🌍 Key Features:
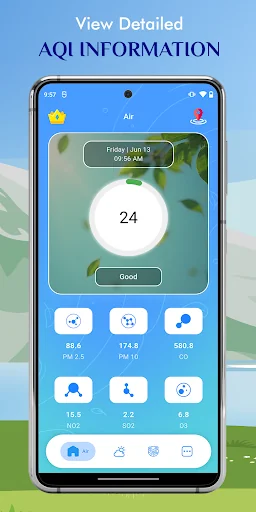
📍 Live AQI Data
Real-time AQI and pollution levels by city, including key pollutants: PM2.5, PM10, CO, NO₂, O₃, SO₂, and more.
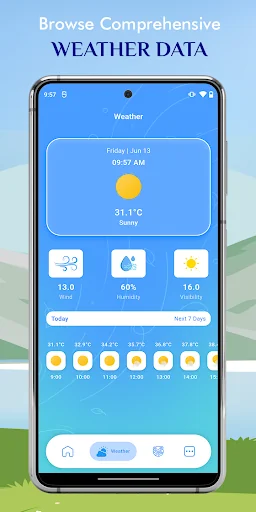
☁️ Weather Information
Get current weather conditions including temperature, humidity, wind, sunrise & sunset, a…
Stay informed and breathe better with real-time Air Quality Index (AQI) and weather data from around the world. Track air pollution, monitor key pollutants, and view accurate weather updates to make smarter health and travel decisions.
🌍 Key Features:
📍 Live AQI Data
Real-time AQI and pollution levels by city, including key pollutants: PM2.5, PM10, CO, NO₂, O₃, SO₂, and more.
☁️ Weather Information
Get current weather conditions including temperature, humidity, wind, sunrise & sunset, and weekly forecasts.
🗺️ Map View
Explore AQI levels for nearby cities on an interactive map.
⭐ Favorite Places
Save your frequently checked locations for quick access to air quality and weather data.
📰 Air Quality News
Get the latest news and updates on pollution and environmental health.
📊 AQI Chart
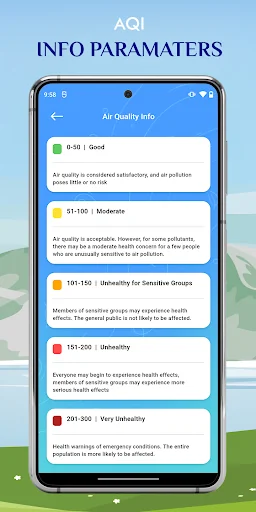
Understand pollution levels with a simple, color-coded chart—from Good to Hazardous—with health guidance.
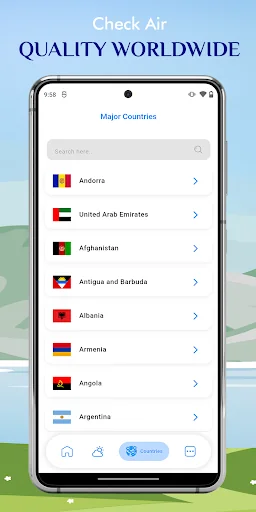
🌐 Country & City Selector
Browse AQI by country and city with flags for easier recognition of your location.
⚠️ AQI Levels Explained:
Green (0–50): Good – Air quality is satisfactory
Yellow (51–100): Moderate – Acceptable, minor risks for sensitive people
Orange (101–150): Unhealthy for sensitive groups
Red (151–200): Unhealthy – Everyone may begin to feel effects
Purple (201–300): Very Unhealthy – Health warnings issued
Brown (301+): Hazardous – Emergency conditions
Stay ahead of pollution and changing weather conditions. Download now to track air quality and weather, wherever you are.
Comparable Android apps
The five apps in Weather with the closest revenue to Air Quality Index. Click any to see its detail page.
Each forecast combines App Store rating, ratings count, monetisation model, pricing tier, IAP signals and ad-supported flag.
The base estimate is then multiplied by a per-category scaling factor learned from apps with founder-verified MRR.
Every number on this page comes from public APIs and bumetric's own snapshot history.
Full methodology covers input variables, accuracy bands per category and how we treat apps without comparable anchors.
See also the live data on Air Quality Index's tracker page for current rating, reviews and snapshot timeline.
Building something similar? Get a free AI audit with $-revenue forecasts for every recommendation.
 Sensor Blue
 UV-INDEKS
 Airveda - Air Quality
 Tuk Tuk Taxi Driving Games 3D
 Moldova Weather