Android app
from Irvine Management Company
· Lifestyle
ML forecast★ 2.2 · 317Free
~281/mo
ML revenue forecast.
Calibrated against 51929 apps in this category.
Confidence band
±15%
High — many comparable apps with verified data
At a glance
Earns 1.67× more than the category median (168/mo).
Ranks #12,512 of 51,929 in Lifestyle (top 24.1% by revenue).
Launched Apr 02, 2016 · last updated Mar 07, 2026.
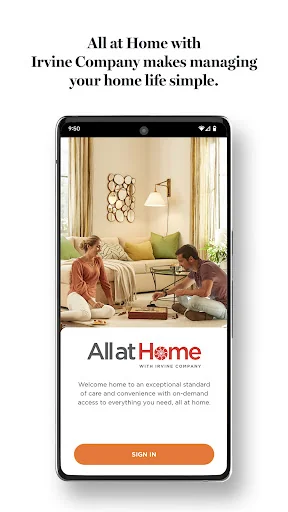
What the app looks like
Live screenshots from the Play Store, captured by our snapshot worker. Tap any image to enlarge.
All at Home's revenue trajectory
Forecast revenue from snapshot history. Last 1 months.
Where All at Home sits in Lifestyle
Revenue distribution of 51929 comparable apps. All at Home highlighted.
All at Home vs comparable apps
Revenue trajectory side-by-side. Bold = All at Home, ghosted = peers.
App spec
Version
5.6.6
Last update
Mar 07, 2026
Launched
Apr 02, 2016
Price
Free
Monetization
Free
What All at Home actually does (from store listing)
Whether you’re making a payment, requesting service, reserving an amenity space or checking on a delivery, get it done in one place with All at Home with Irvine Company.
Key features in the app include:
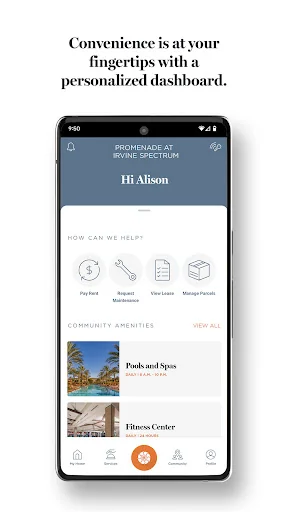
- Personalized dashboard with easy navigation to help you get things done simply.
- Convenient self-service features like paying rent, renewing a lease, submitting maintenance requests, uploading proof of renters insurance, and making appointments.
- Real-time notifications detailing th…
Whether you’re making a payment, requesting service, reserving an amenity space or checking on a delivery, get it done in one place with All at Home with Irvine Company.
Key features in the app include:
- Personalized dashboard with easy navigation to help you get things done simply.
- Convenient self-service features like paying rent, renewing a lease, submitting maintenance requests, uploading proof of renters insurance, and making appointments.
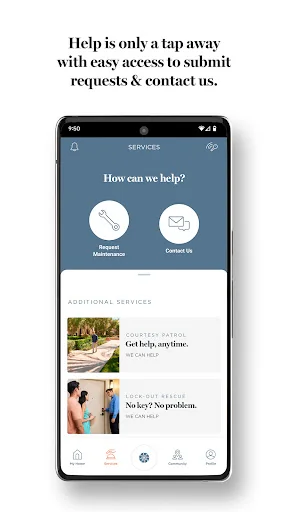
- Real-time notifications detailing the progress of maintenance service requests, community updates and parcel delivery status*.
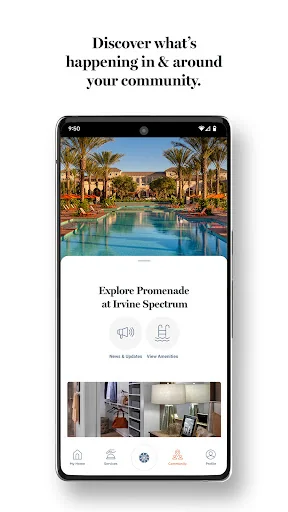
- Access to specific community information like amenity hours, utility providers, electric vehicle charging, community site map, and FAQs.
- Classifieds marketplace for buying & selling with neighbors, with an intuitive shopping interface & easy listing management to edit or delete items you’re selling.
*At select communities.
Comparable Android apps
The five apps in Lifestyle with the closest revenue to All at Home. Click any to see its detail page.
Each forecast combines App Store rating, ratings count, monetisation model, pricing tier, IAP signals and ad-supported flag.
The base estimate is then multiplied by a per-category scaling factor learned from apps with founder-verified MRR.
Every number on this page comes from public APIs and bumetric's own snapshot history.
Full methodology covers input variables, accuracy bands per category and how we treat apps without comparable anchors.
See also the live data on All at Home's tracker page for current rating, reviews and snapshot timeline.
Building something similar? Get a free AI audit with $-revenue forecasts for every recommendation.

 KICC Church
 iTrackEasy
 Talk2You: Couple Conversations
 iParoquiano: Paroquiano Online
 Chacon Home