1.2M Assets Tracked Updated 3 min ago Revenue Forecasts
Add an app Create Account Sign In
Home
Android TV Core Services icon

How much does Android TV Core Services earn?

Android app from Google LLC · Tools

ML forecast ★ 2.9 · 3K → Stable Free

~668/mo

ML revenue forecast. Calibrated against 77129 apps in this category.

Confidence band
±15%
High — many comparable apps with verified data

At a glance

What the app looks like

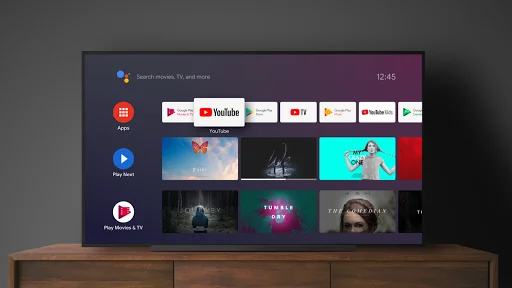
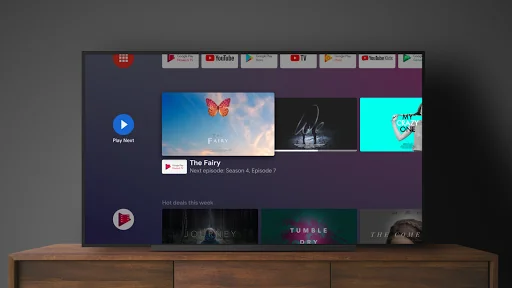
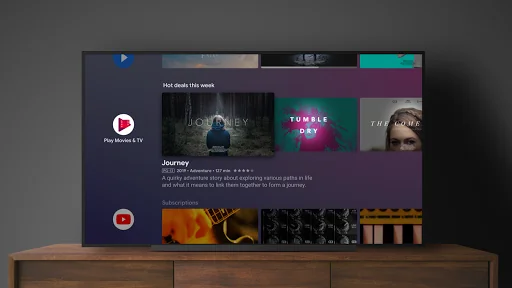
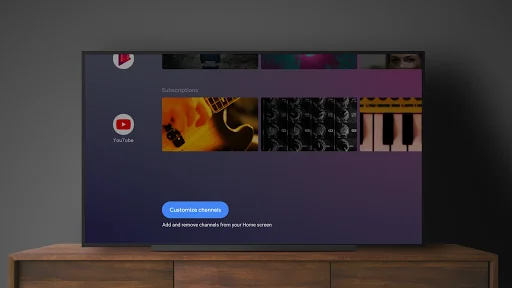
Live screenshots from the Play Store, captured by our snapshot worker. Tap any image to enlarge.

Android TV Core Services screenshot 1 Android TV Core Services screenshot 2 Android TV Core Services screenshot 3 Android TV Core Services screenshot 4

Android TV Core Services's revenue trajectory

Forecast revenue from snapshot history. Last 2 months.

Where Android TV Core Services sits in Tools

Revenue distribution of 77129 comparable apps. Android TV Core Services highlighted.

Android TV Core Services vs comparable apps

Revenue trajectory side-by-side. Bold = Android TV Core Services, ghosted = peers.

App spec

Version
7.4.0-848496343-f
Last update
Mar 16, 2026
Launched
Jan 08, 2018
Price
Free
Monetization
Free

What Android TV Core Services actually does (from store listing)

Android TV Core Services is a support package for Android TV devices.

Comparable Android apps

The five apps in Tools with the closest revenue to Android TV Core Services. Click any to see its detail page.

AppRevenueRatingRatings
Rodali Assamese Keyboard icon Rodali Assamese Keyboard 667 ★ 4.2 3K
QR Code Reader - Scanner App icon QR Code Reader - Scanner App 668 ★ 3.2 665
Universal SoundBar Remote Cont icon Universal SoundBar Remote Cont 667 ★ 2.8 4K
Totalcmd Plugin for OneDrive icon Totalcmd Plugin for OneDrive 668 ★ 4.2 2K
Video Downloader - Video Saver icon Video Downloader - Video Saver 668 ★ 3.8 124K
Own Android TV Core Services? Replace our estimate with your real revenue via Stripe Connect or ASC. Get a public Verified badge.
Claim & verify →

How we calculated this

Each forecast combines App Store rating, ratings count, monetisation model, pricing tier, IAP signals and ad-supported flag. The base estimate is then multiplied by a per-category scaling factor learned from apps with founder-verified MRR. Every number on this page comes from public APIs and bumetric's own snapshot history.

Full methodology covers input variables, accuracy bands per category and how we treat apps without comparable anchors. See also the live data on Android TV Core Services's tracker page for current rating, reviews and snapshot timeline.

Building something similar? Get a free AI audit with $-revenue forecasts for every recommendation.
Audit my app →