- Download the Angeloni App and make your supermarket shopping easier!
The Angeloni App brings more convenience to your daily life. Shop quickly, take advantage of exclusive offers, and have Angeloni quality always at hand.
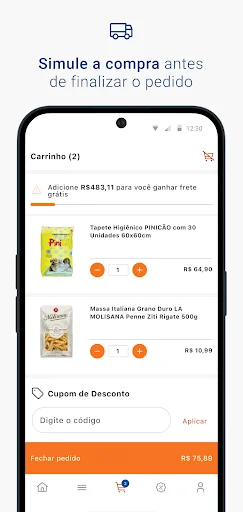
- Quick and easy shopping
Choose your favorite products, build your cart in a few clicks, and complete your purchases simply and securely.
- Delivery or in-store pickup
Receive your purchases at home or pick them up at the nearest Angeloni store. You choose the ide…
- Download the Angeloni App and make your supermarket shopping easier!
The Angeloni App brings more convenience to your daily life. Shop quickly, take advantage of exclusive offers, and have Angeloni quality always at hand.
- Quick and easy shopping
Choose your favorite products, build your cart in a few clicks, and complete your purchases simply and securely.
- Delivery or in-store pickup
Receive your purchases at home or pick them up at the nearest Angeloni store. You choose the ideal option for your routine.
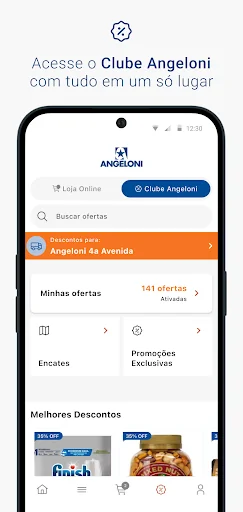
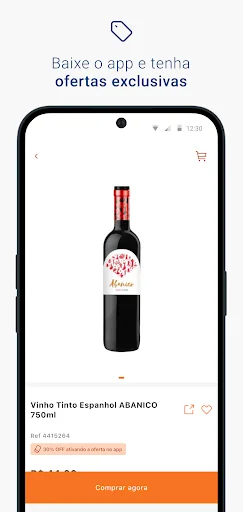
- Offers and promotions in the app
Track discounts, special conditions, and offers available in the app and save on every purchase.
- Personalized shopping list
Create lists, save your favorite products, and gain more speed in your future shopping trips.
- Find Angeloni stores
Locate nearby stores, check opening hours, and have all the information in one place.
- More practicality, more savings, and more convenience
The Angeloni App was developed to make your shopping experience simpler, faster, and more efficient.
- Download the Angeloni App now and have the supermarket with you everywhere!
Comparable Android apps
The five apps in Shopping with the closest revenue to Angeloni. Click any to see its detail page.
Each forecast combines App Store rating, ratings count, monetisation model, pricing tier, IAP signals and ad-supported flag.
The base estimate is then multiplied by a per-category scaling factor learned from apps with founder-verified MRR.
Every number on this page comes from public APIs and bumetric's own snapshot history.
Full methodology covers input variables, accuracy bands per category and how we treat apps without comparable anchors.
See also the live data on Angeloni's tracker page for current rating, reviews and snapshot timeline.
Building something similar? Get a free AI audit with $-revenue forecasts for every recommendation.

 Kimovil
 ingatlan.com
 Shopping Sunday
 Supermercado Lider App
 My Metro