Birds are flying and chickens are running!
Angry Rex very hungry now!
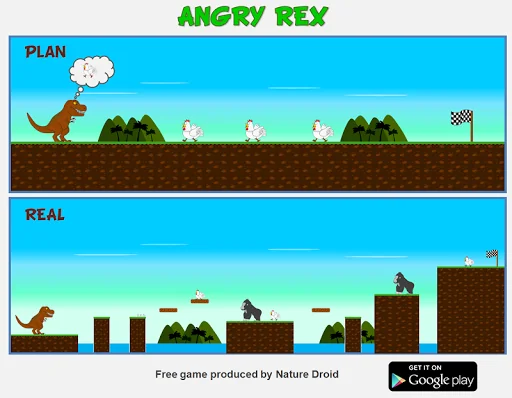
Control T-Rex (Tyrannosaurus Rex) to eat chickens & birds as much as possible in given time!
The birds fly faster & faster!
Chase them!
Eat egg can add your score.
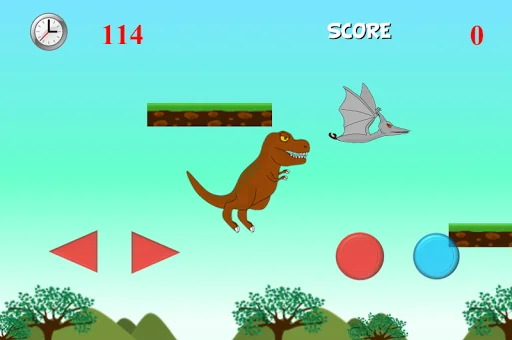
Control:
Left & right: Arrow
Jump: Red button
Bite: Blue button
Jump & bite: Red button follow by blue button
Jump to left or right: Arrow +Red button
Jump to left or right & bite: Arrow +Red button follow by blue button
Additive dinos…
Control T-Rex (Tyrannosaurus Rex) to eat chickens & birds as much as possible in given time!
The birds fly faster & faster!
Chase them!
Eat egg can add your score.
Control:
Left & right: Arrow
Jump: Red button
Bite: Blue button
Jump & bite: Red button follow by blue button
Jump to left or right: Arrow +Red button
Jump to left or right & bite: Arrow +Red button follow by blue button
Additive dinosaur platform game! There are 3 world & total 36 levels.
Comparable Android apps
The five apps in Arcade with the closest revenue to Angry Rex. Click any to see its detail page.
Each forecast combines App Store rating, ratings count, monetisation model, pricing tier, IAP signals and ad-supported flag.
The base estimate is then multiplied by a per-category scaling factor learned from apps with founder-verified MRR.
Every number on this page comes from public APIs and bumetric's own snapshot history.
Full methodology covers input variables, accuracy bands per category and how we treat apps without comparable anchors.
See also the live data on Angry Rex's tracker page for current rating, reviews and snapshot timeline.
Building something similar? Get a free AI audit with $-revenue forecasts for every recommendation.


 Peece Maker
 Air Dance
 MSX Games File-Hunter.com
 Mob Control
 Bad-Toys